Fig. B.1
Download original image
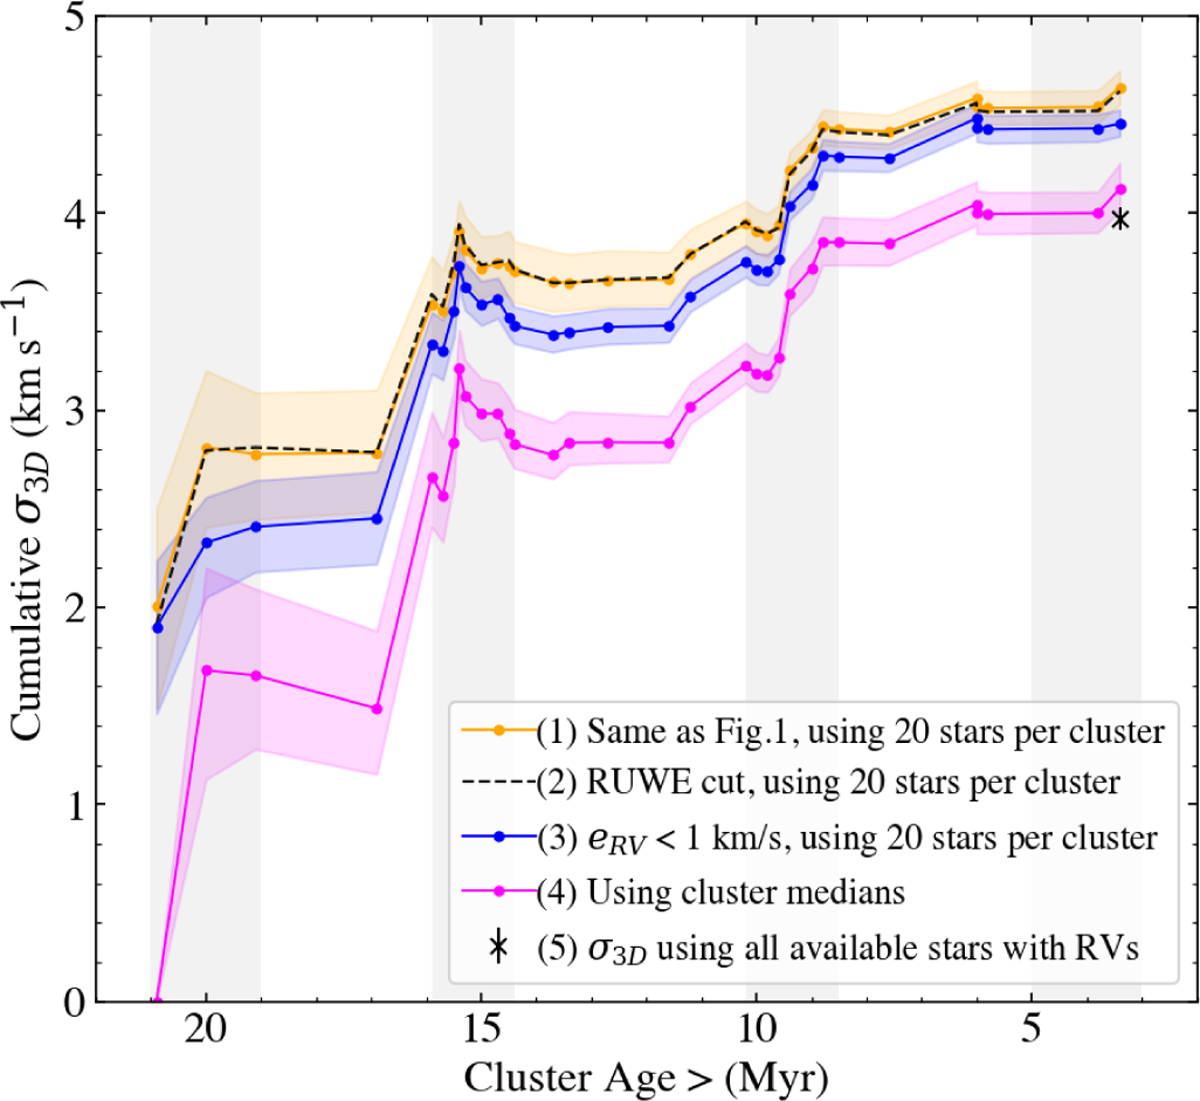
Influence of measurement errors or binaries on the cumulative σ3D. (1) The upper orange curve is the fiducial one from Fig. 1. (2) The dashed black curve shows the cumul. σ3D when applying a cut on the Gaia RUWE parameter, to test the influence of binaries. (3) The middle blue curve shows the cumul. σ3D when applying an additional error cut at eRV ≤ 1 km s−1 on the stellar members of each cluster. (4) The magenta curve shows the cumul. σ3D when using the cluster medians. (5) The black cross marks the total σ3D as calculated from all stars in Sco-Cen with valid RV measurements. The error bars (shaded regions) show the 95% interquartile ranges (2σ).
Current usage metrics show cumulative count of Article Views (full-text article views including HTML views, PDF and ePub downloads, according to the available data) and Abstracts Views on Vision4Press platform.
Data correspond to usage on the plateform after 2015. The current usage metrics is available 48-96 hours after online publication and is updated daily on week days.
Initial download of the metrics may take a while.