Fig. 7
Download original image
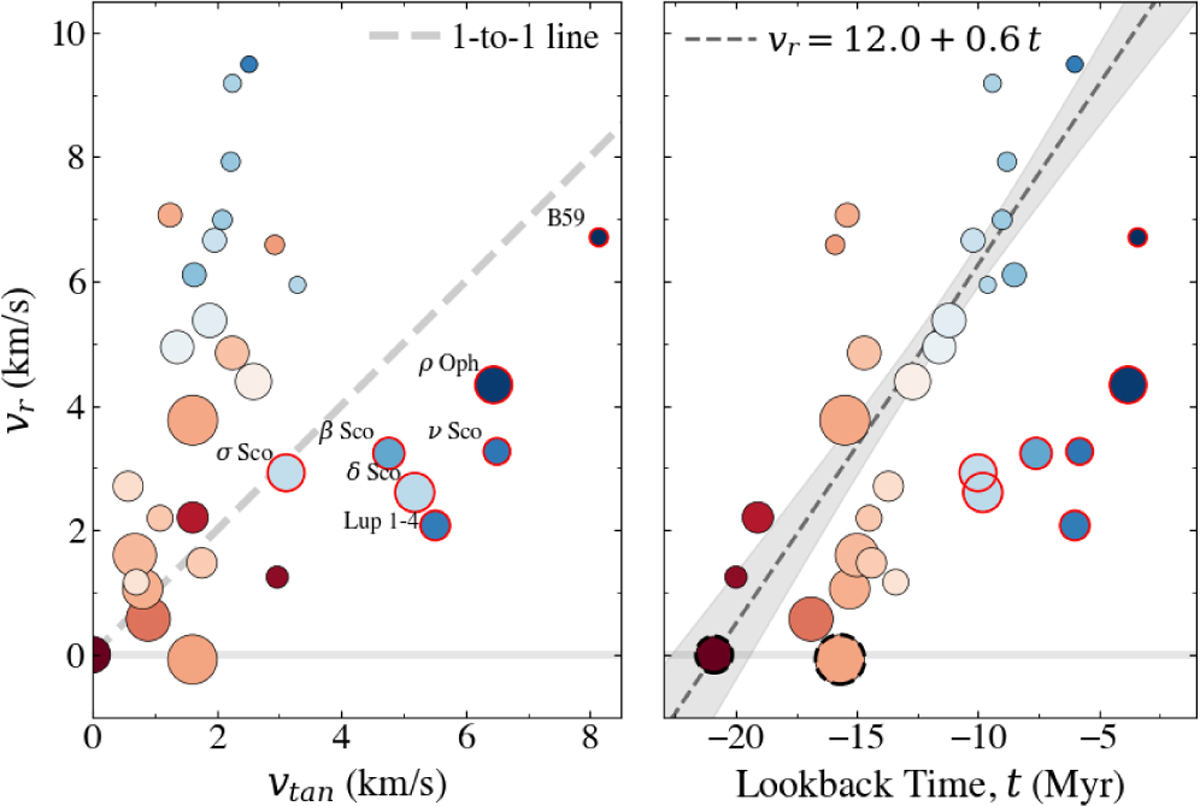
Radial component of the relative cluster motions (vr) versus the tangential component (vtan) (left panel), and versus formation time (right panel), with e Lup as a reference point. Symbols and colours are as in Fig. 4. The dashed grey line in the left panel is a 1-to-1 line. The dashed dark grey line in the right panel shows a linear fit to data of 23 clusters, after removing the seven red-circled and the two dashed black-circled clusters. The solid light grey line at vr = 0 in both panels marks the transition from radial outward motion (> 0) to inward motion (< 0).
Current usage metrics show cumulative count of Article Views (full-text article views including HTML views, PDF and ePub downloads, according to the available data) and Abstracts Views on Vision4Press platform.
Data correspond to usage on the plateform after 2015. The current usage metrics is available 48-96 hours after online publication and is updated daily on week days.
Initial download of the metrics may take a while.