Fig. 6
Download original image
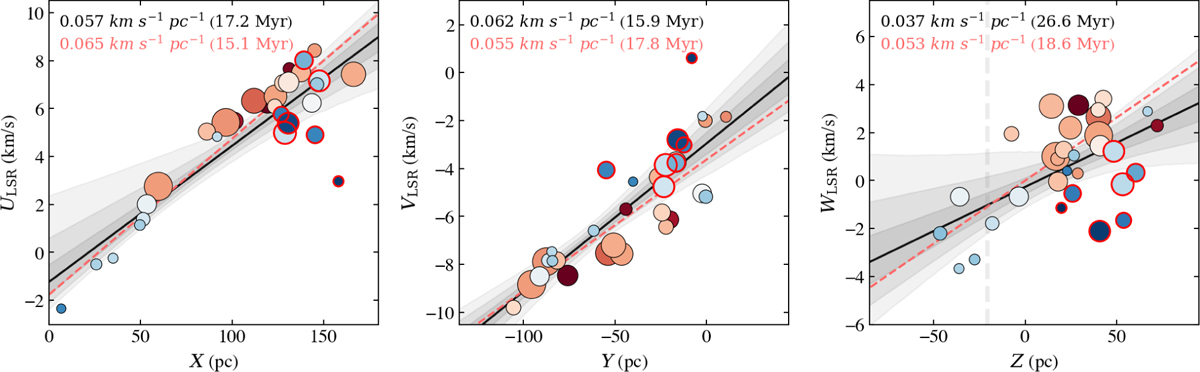
Position velocity (PV) diagrams for the 32 Sco-Cen clusters using the XU, YV, and ZW spaces. Symbols and colours as in Fig. 4. The median slopes of the fitted linear regressions (solid black lines) are given in the upper left corners. The shaded grey areas are the 1-2-3σ uncertainty ranges. The inverse of the slope gives a time in million years, in brackets, marking the possible onset of expansion. The dashed red slopes are the linear fitting results when using only 25 clusters, after removing seven clusters with peculiar tangential motions, marked with red circles (see Sect. 5.2). In the ZW diagram (right panel), the vertical dashed grey line indicates the approximate location of the Galactic mid-plane, assuming that the Sun is located about 21 pc above the plane (e.g. Bennett & Bovy 2019).
Current usage metrics show cumulative count of Article Views (full-text article views including HTML views, PDF and ePub downloads, according to the available data) and Abstracts Views on Vision4Press platform.
Data correspond to usage on the plateform after 2015. The current usage metrics is available 48-96 hours after online publication and is updated daily on week days.
Initial download of the metrics may take a while.