Fig. 5
Download original image
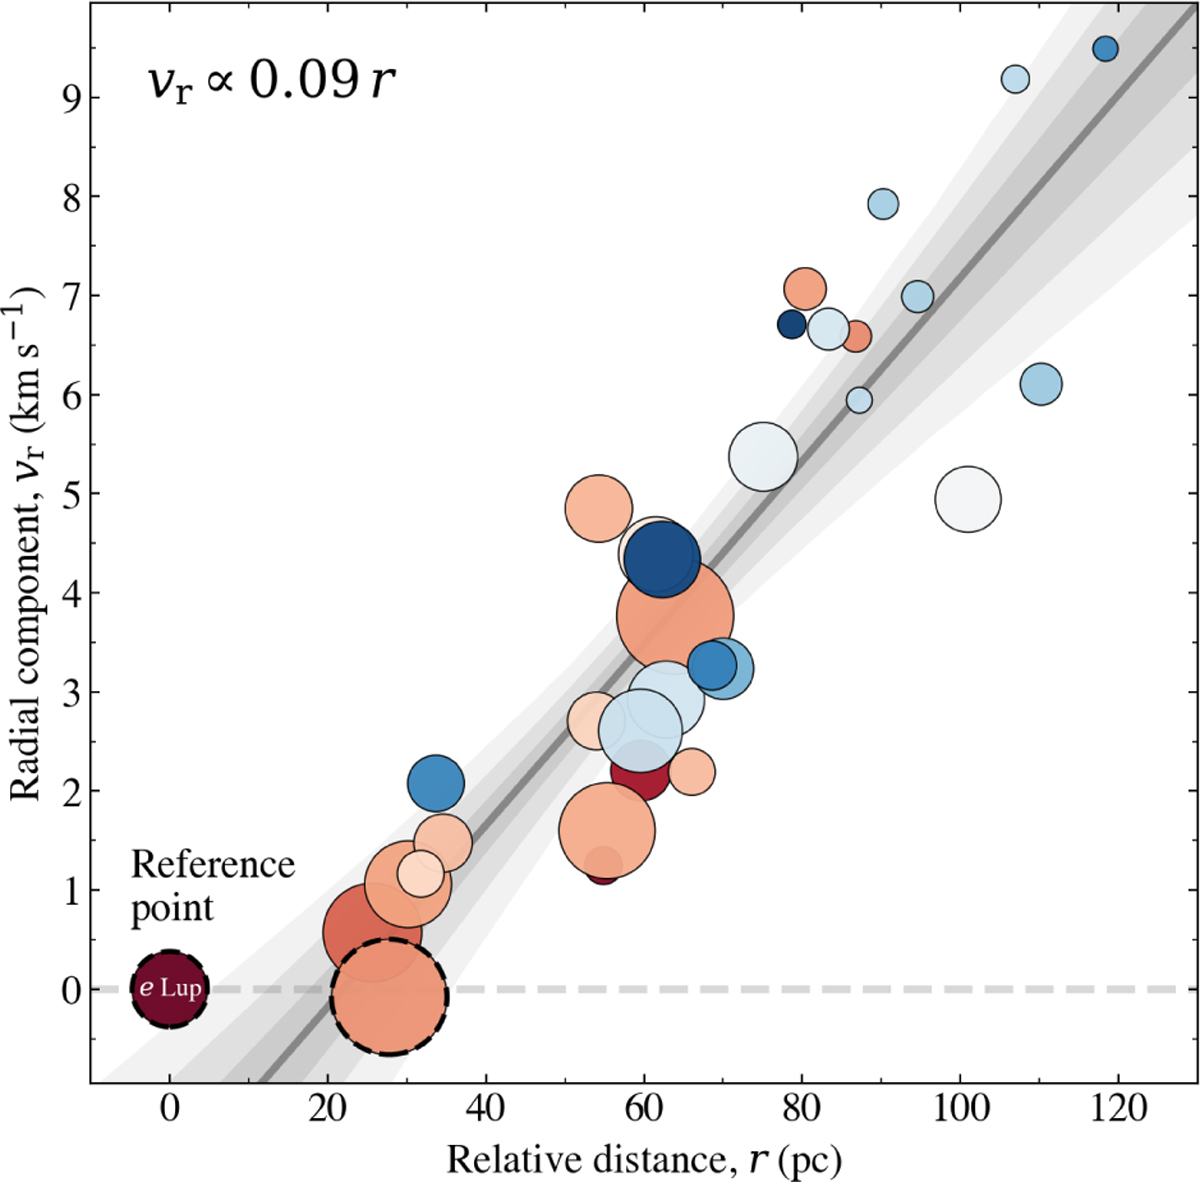
Radial-motion-distance relation. Radial component of the relative cluster motions (vr) versus relative cluster distance (r), with e Lup as a reference point. The symbols are colour-coded by formation time, as in Fig. 4. A linear fit to the data is shown as a solid grey line, with the best-fitting slope given in the upper left corner, and the 1-2-3σ fit uncertainties are plotted as shaded grey areas. The two clusters marked by dashed black circles (e Lup, ν Cen) are excluded from the linear fit.
Current usage metrics show cumulative count of Article Views (full-text article views including HTML views, PDF and ePub downloads, according to the available data) and Abstracts Views on Vision4Press platform.
Data correspond to usage on the plateform after 2015. The current usage metrics is available 48-96 hours after online publication and is updated daily on week days.
Initial download of the metrics may take a while.