Fig. 4
Download original image
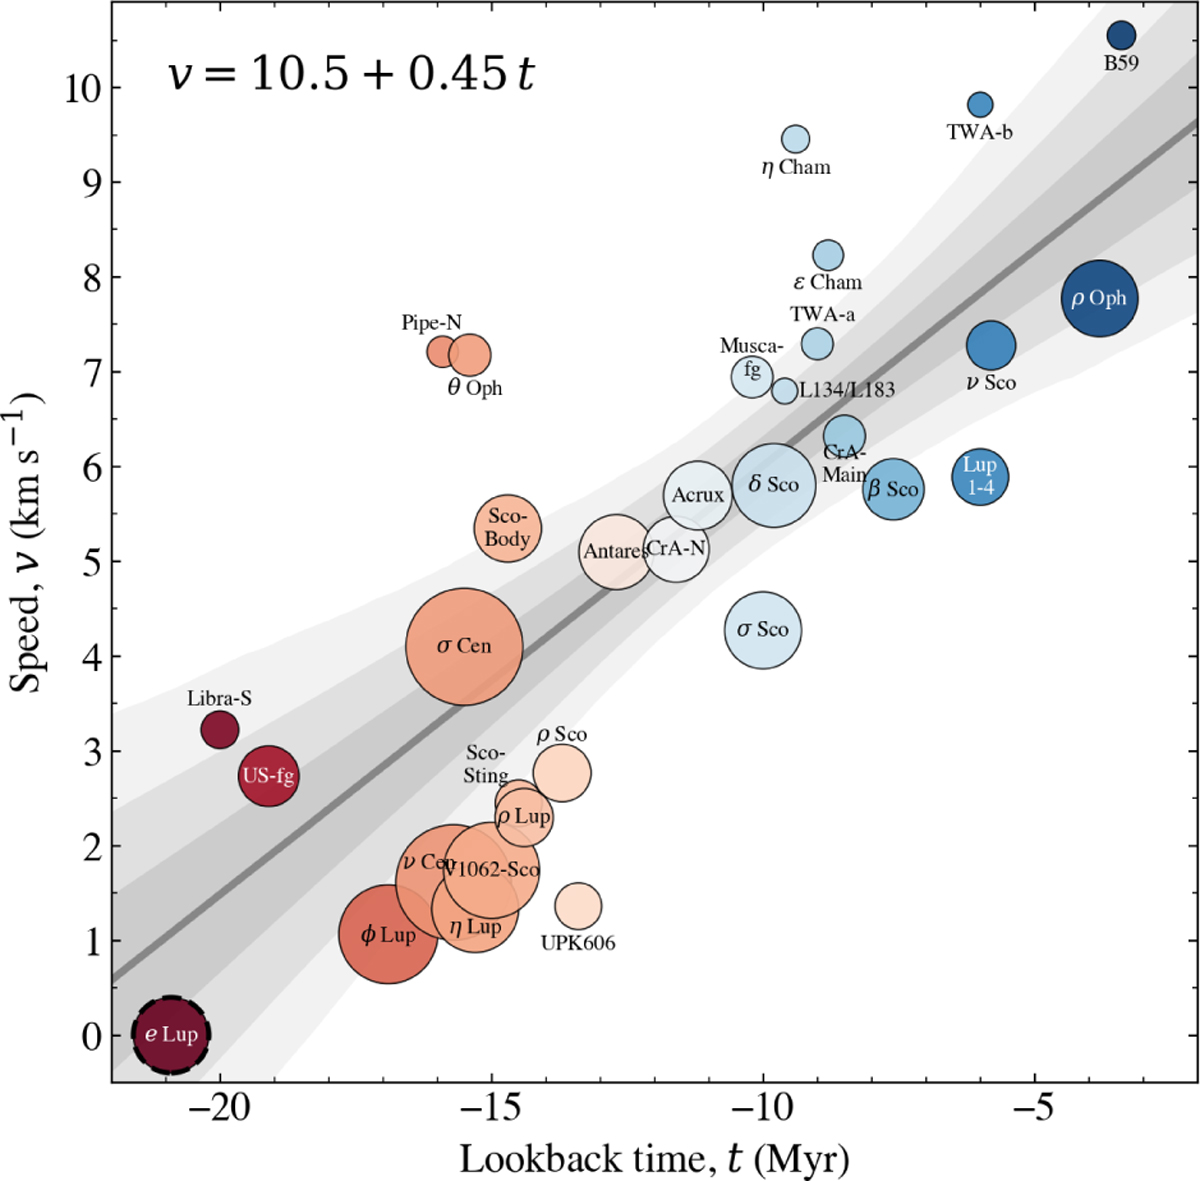
Speed-time relation. Relative cluster speed (v) versus lookback time (t), with the oldest cluster (e Lup) as a reference point that is excluded from the linear fit (dashed black circle). The symbols are colour-coded by formation time (or cluster age; see the x-axis) and scaled by number of sources per cluster. The linear fit (solid grey line) was obtained via bootstrapping, with the median fitting parameters given in the upper left corner. The fit uncertainties are plotted as shaded grey areas (1-2-3 σ).
Current usage metrics show cumulative count of Article Views (full-text article views including HTML views, PDF and ePub downloads, according to the available data) and Abstracts Views on Vision4Press platform.
Data correspond to usage on the plateform after 2015. The current usage metrics is available 48-96 hours after online publication and is updated daily on week days.
Initial download of the metrics may take a while.