Fig. 3
Download original image
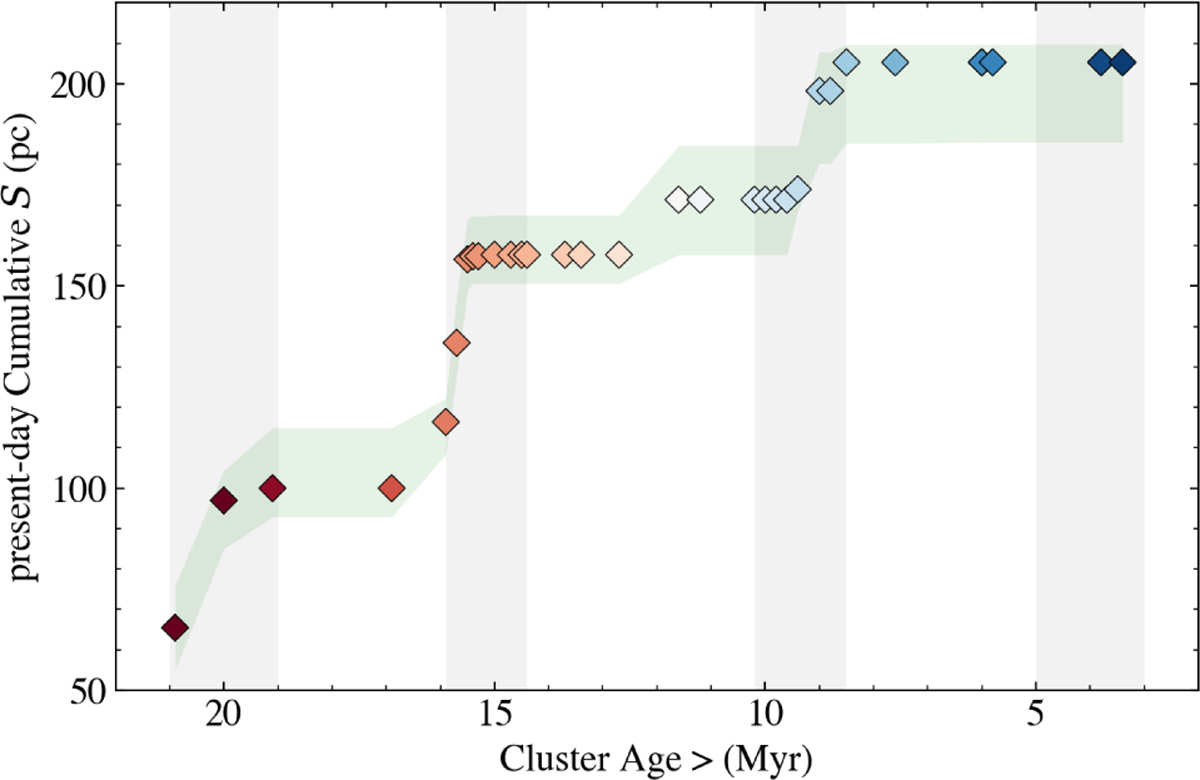
Present-day cumulative size of Sco-Cen, when ordering and adding the stellar cluster members by their decreasing age (without considering orbital trace-backs). The sizes can be seen as upper limits of the region’s size at a given age, but not as the true physical extent before the present-day, which was likely smaller (see Sect. 5.4). The shaded green area shows the 95% interquartile range (2σ; see Appendix B.2). The colours and grey bars are as in Fig. 1.
Current usage metrics show cumulative count of Article Views (full-text article views including HTML views, PDF and ePub downloads, according to the available data) and Abstracts Views on Vision4Press platform.
Data correspond to usage on the plateform after 2015. The current usage metrics is available 48-96 hours after online publication and is updated daily on week days.
Initial download of the metrics may take a while.