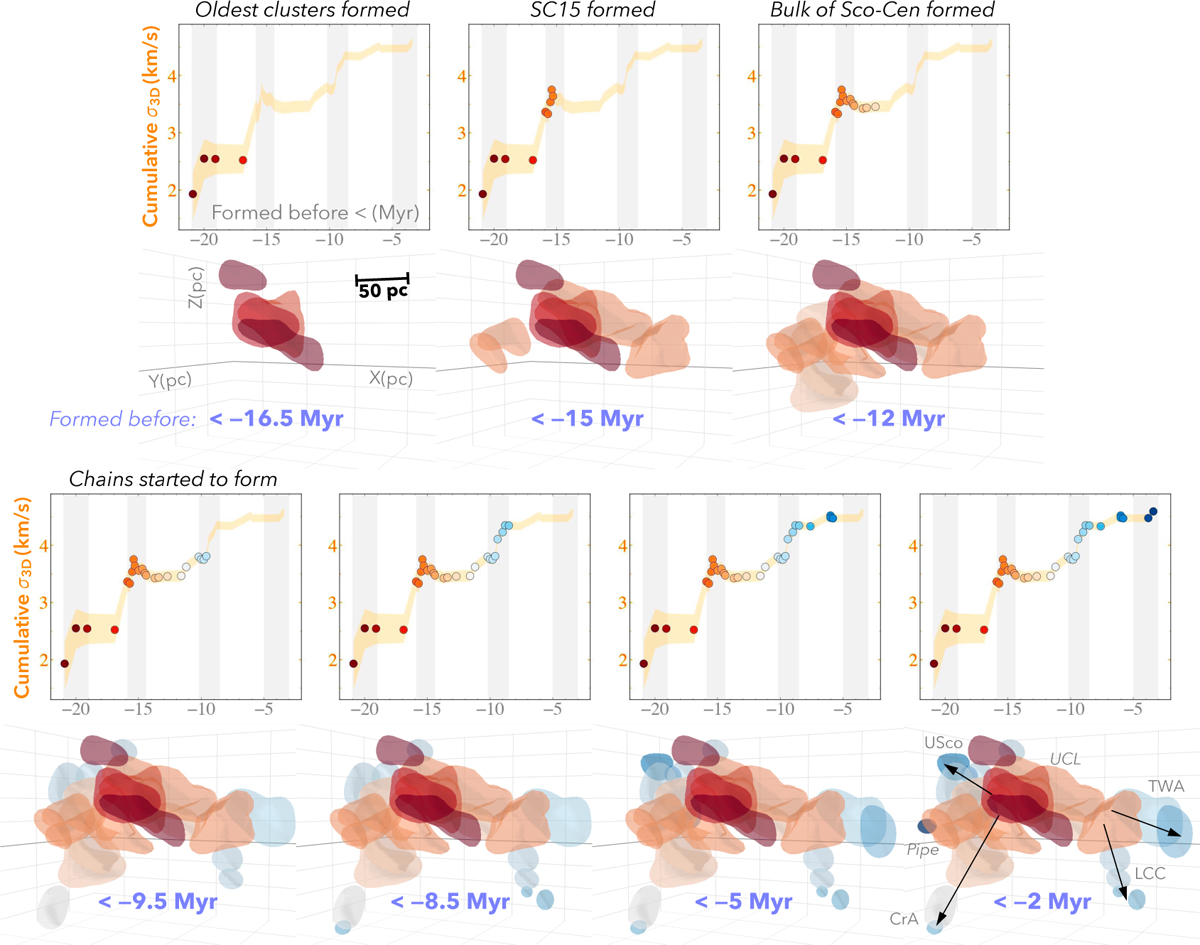
Fig. 2
Download original image
3D spatial distribution of clusters in Sco-Cen together with the cumulative σ3D. The seven panels show seven age ranges, which dissect the chronological build-up of Sco-Cen. The upper panels display the cumulative 3D velocity dispersion (as in Fig. 1). Below each graph, seven 3D age maps depict the present-day spatial distribution of clusters (in XYZ). The clusters are represented by their enveloping surfaces and colour-coded by age. Each of the seven panels only shows the clusters that formed before the indicated cluster formation times. The shown cluster sizes can be interpreted as upper limits of the region’s size at a given age and not as the true physical extent before the present-day, which was likely smaller (see Sect. 5.4). The figure illustrates which clusters contribute to which jumps or steps in the cumulative σ3D. Sub-regions and cluster chains are labelled in the final panel. The 3D visualisations originate from R23b and MR25; interactive versions are available in the respective publications.
Current usage metrics show cumulative count of Article Views (full-text article views including HTML views, PDF and ePub downloads, according to the available data) and Abstracts Views on Vision4Press platform.
Data correspond to usage on the plateform after 2015. The current usage metrics is available 48-96 hours after online publication and is updated daily on week days.
Initial download of the metrics may take a while.