Fig. B.2
Download original image
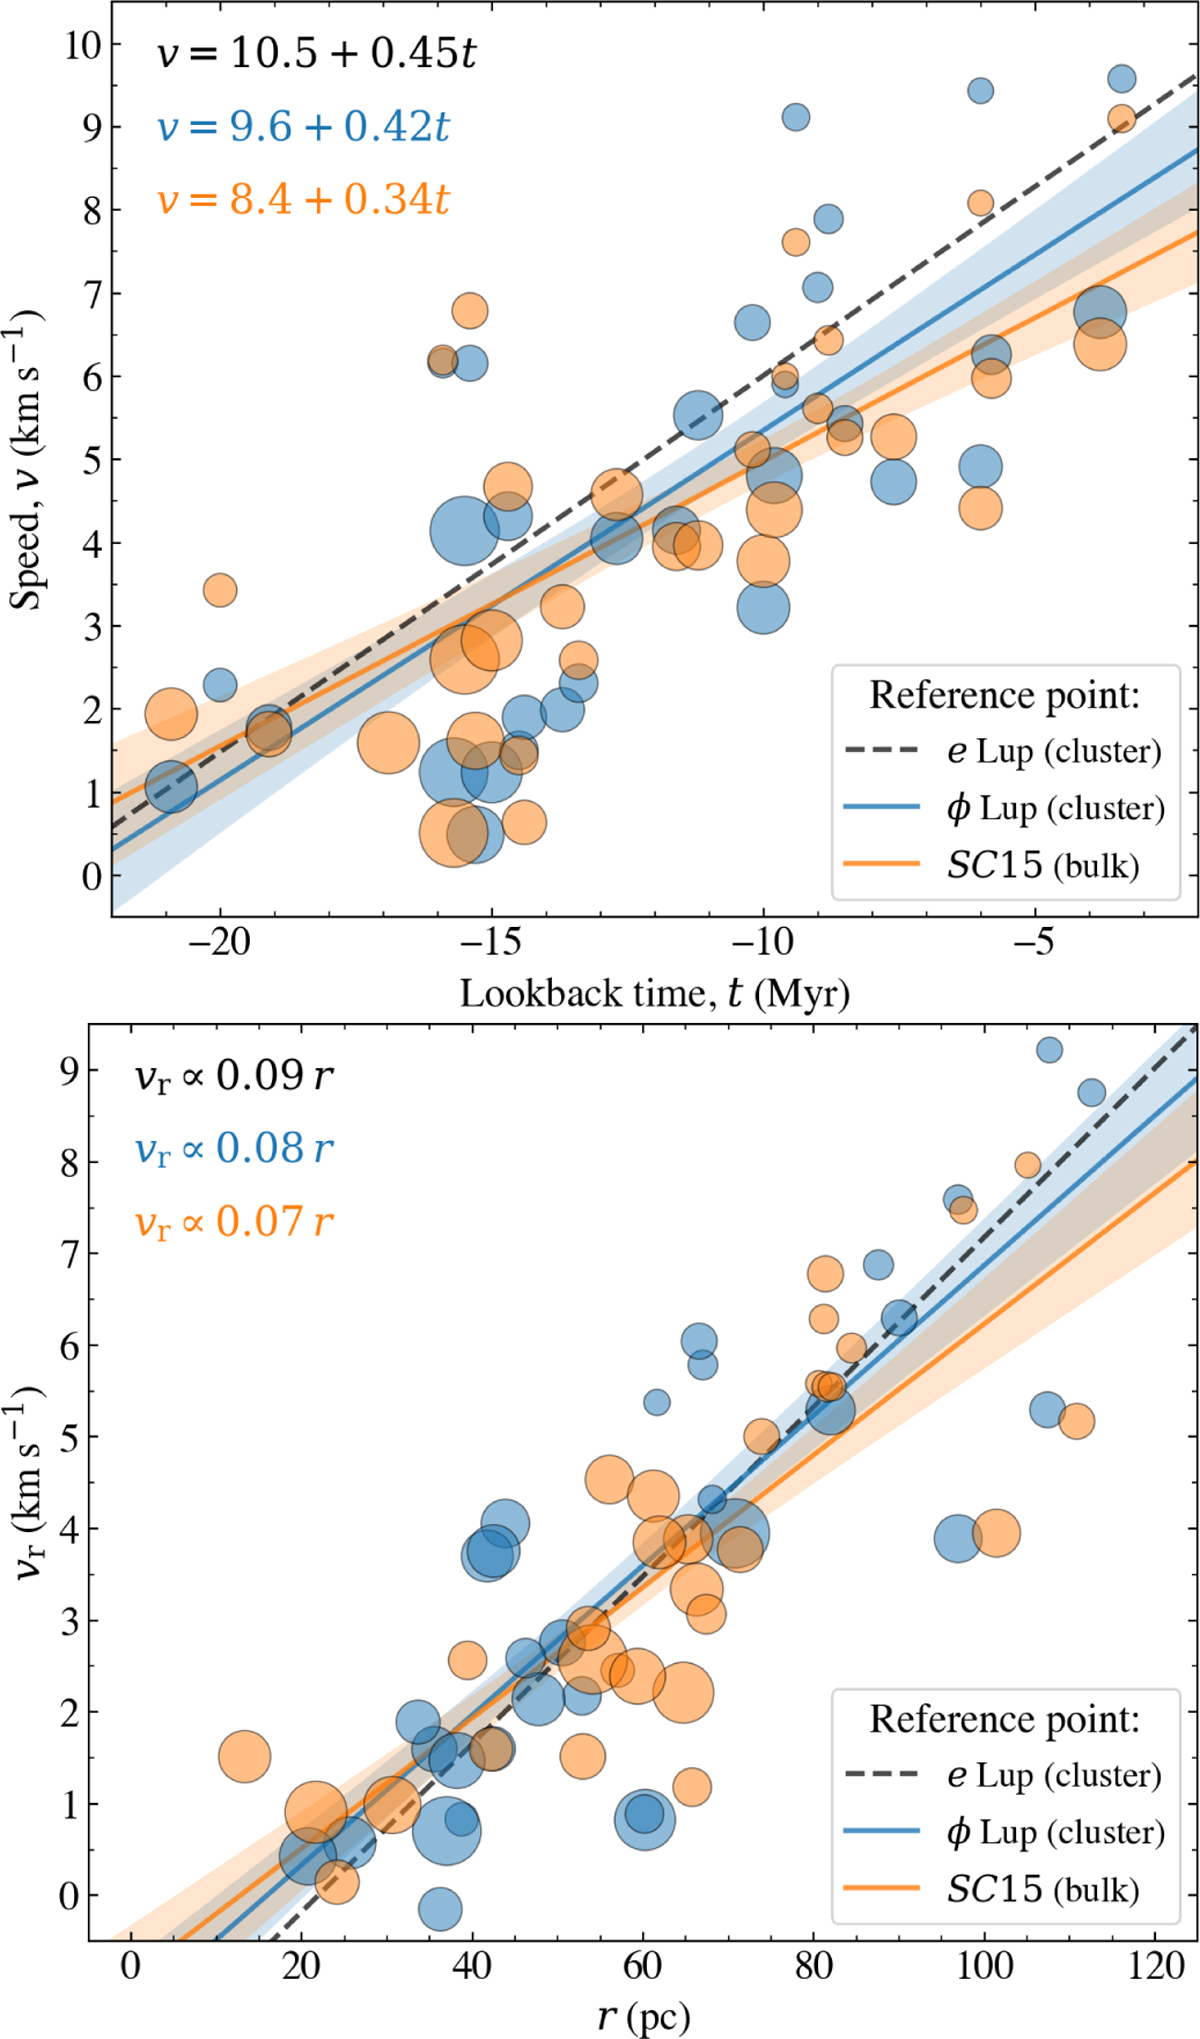
Speed-time relation (top panel, similar as Fig. 4) and Radialcomponent-distance relation (bottom panel, similar as Fig. 5), with φ Lup (blue) or SC15 (orange) as reference points. For comparison, we also show the slopes when e Lup is set as the reference point, from Fig. 4 or 5 (dashed black lines). The resulting median slopes are given in the upper left corners in the respective colours (see also Table 1). The shaded areas show the 1σ uncertainties around the median slopes.
Current usage metrics show cumulative count of Article Views (full-text article views including HTML views, PDF and ePub downloads, according to the available data) and Abstracts Views on Vision4Press platform.
Data correspond to usage on the plateform after 2015. The current usage metrics is available 48-96 hours after online publication and is updated daily on week days.
Initial download of the metrics may take a while.