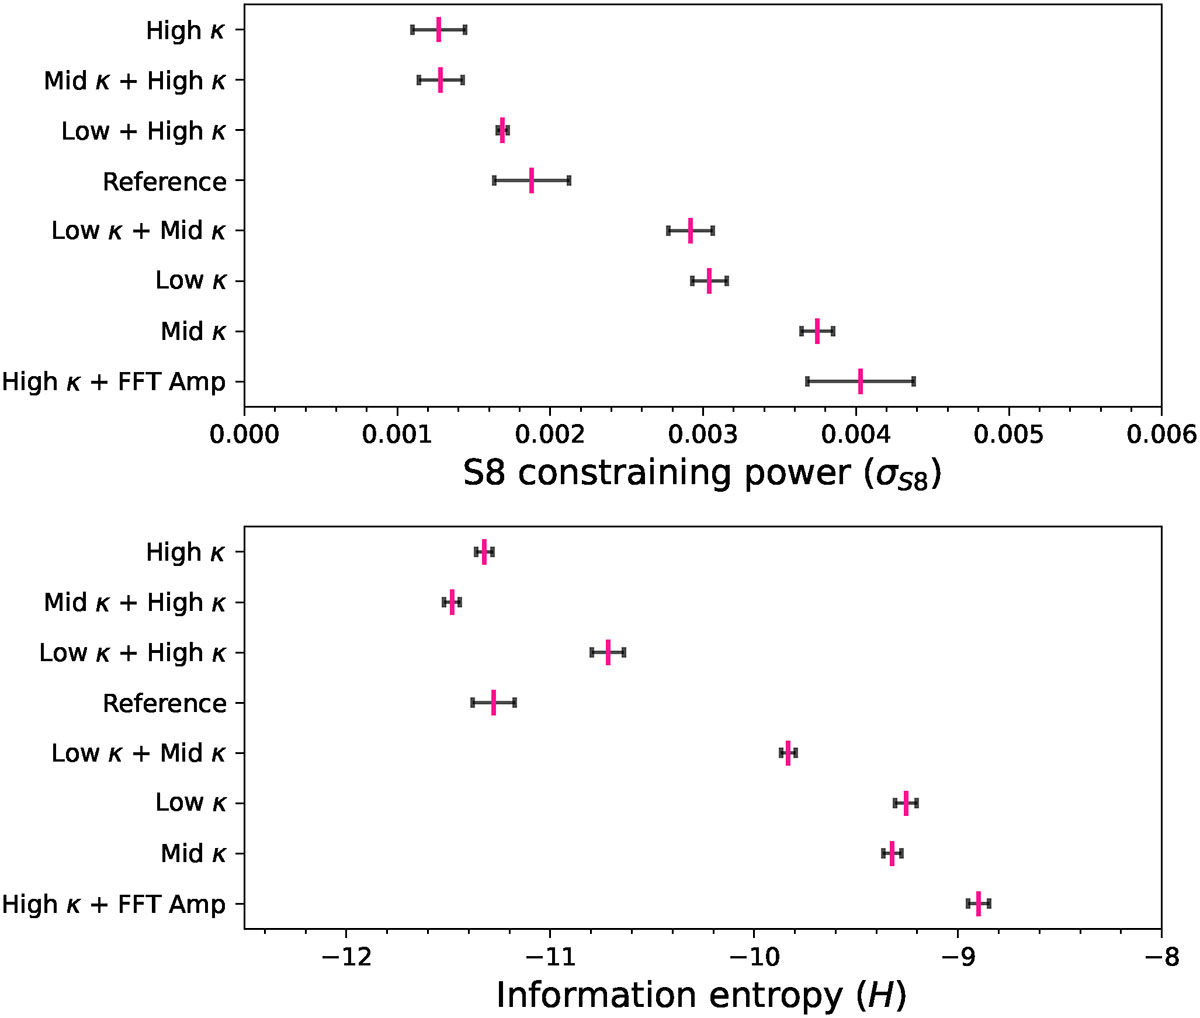
Fig. A.2.
Download original image
CNN performance for various convergence regions selections, when excluding shape noise. Top panel is σS8, the constraining power on S8, bottom panel is H, the information entropy. Low/mid/high κ denotes the low/mid/high convergence regions. The second row presents the performance of a network taking as input the high convergence regions in one channel and the Fourier transform amplitude in another, to mimic a summary statistics analysis method capable of extracting non-Gaussian information: the combination of the PS and peak counts/Minkowski functionals.
Current usage metrics show cumulative count of Article Views (full-text article views including HTML views, PDF and ePub downloads, according to the available data) and Abstracts Views on Vision4Press platform.
Data correspond to usage on the plateform after 2015. The current usage metrics is available 48-96 hours after online publication and is updated daily on week days.
Initial download of the metrics may take a while.