Fig. 4.
Download original image
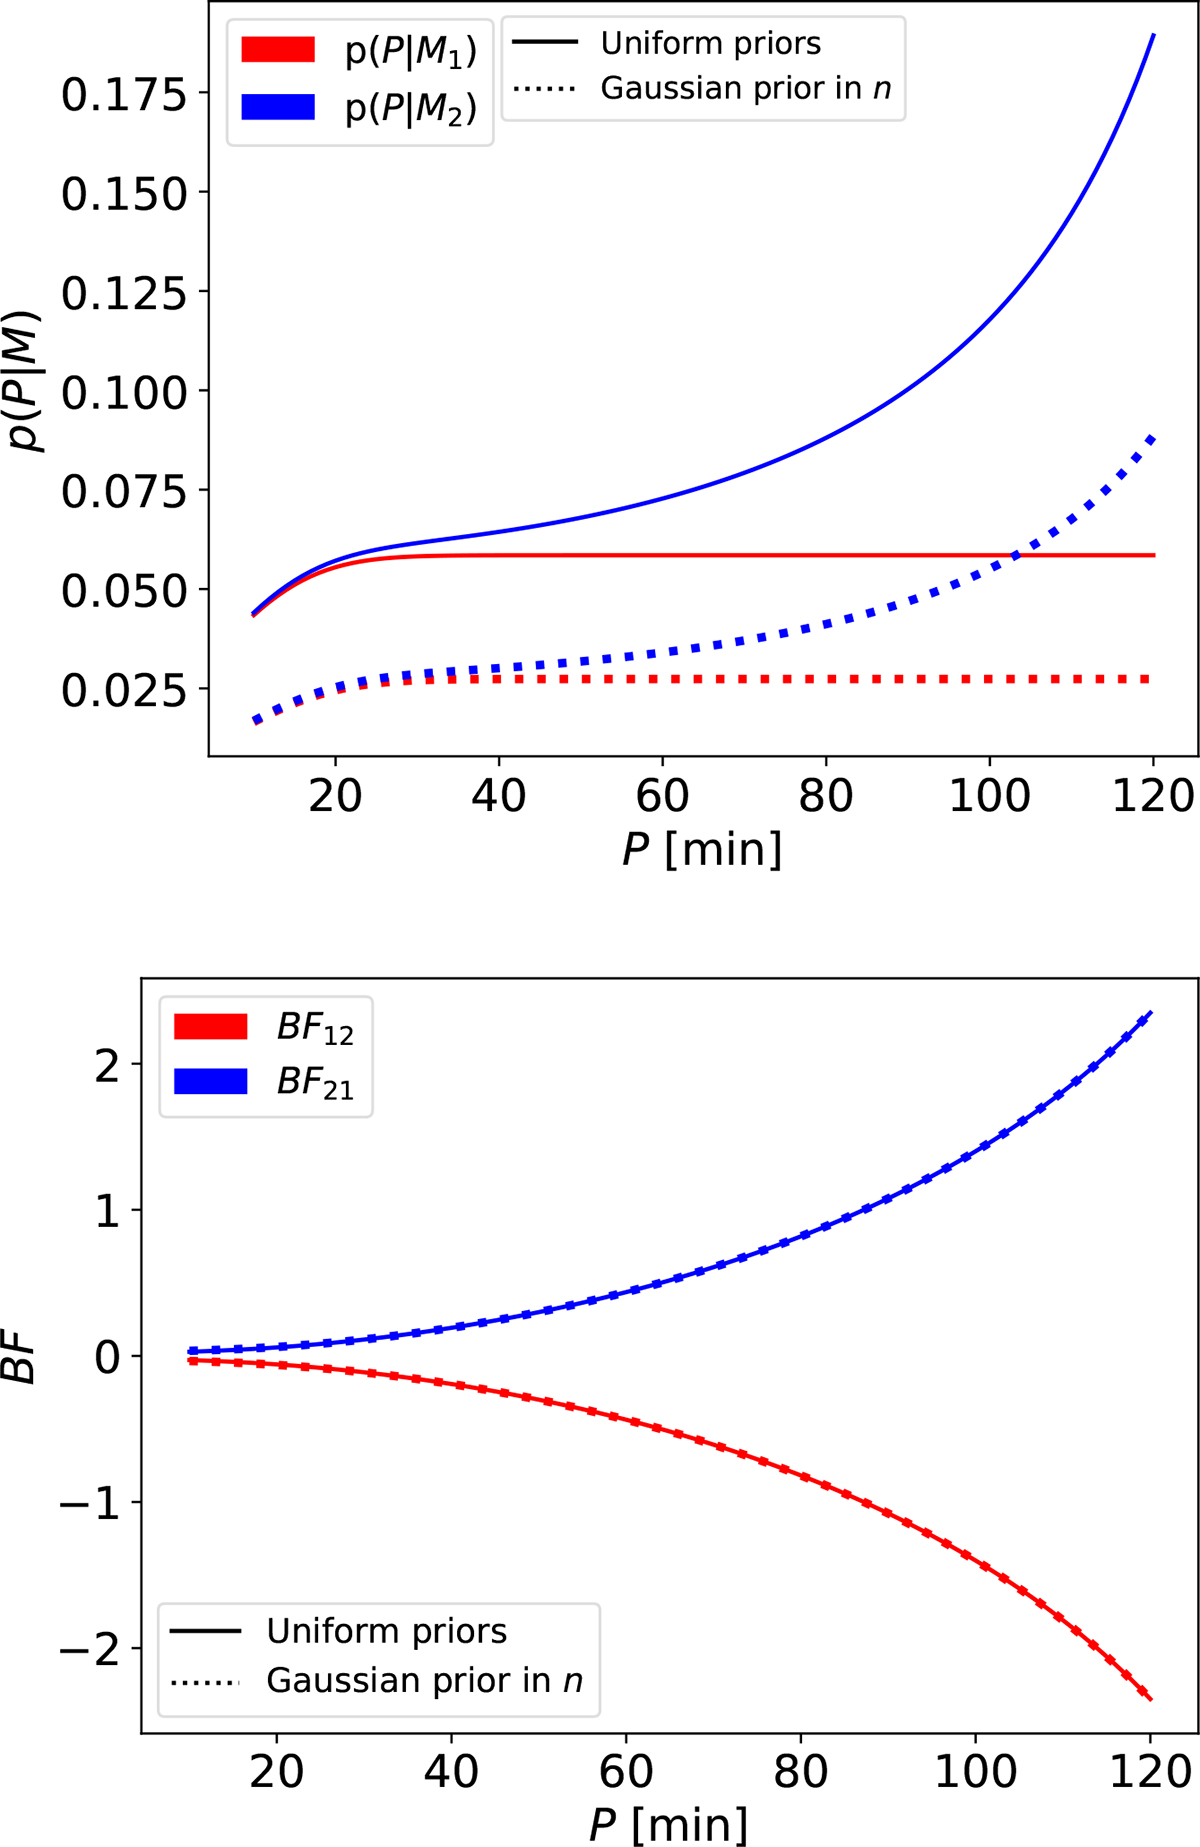
Top: Marginal likelihood for models M1 and M2 as a function of the period, with uncertainty, computed using Equation (14). Bottom: Bayes factors for the relative plausibility between M1 and M2 as a function of the oscillation period, computed using Equation (15). The solid (dotted) line corresponds to the use of uniform (Gaussian) priors. A value of σP = 10 min and a 2D grid with Nn = NB = 800 points were considered.
Current usage metrics show cumulative count of Article Views (full-text article views including HTML views, PDF and ePub downloads, according to the available data) and Abstracts Views on Vision4Press platform.
Data correspond to usage on the plateform after 2015. The current usage metrics is available 48-96 hours after online publication and is updated daily on week days.
Initial download of the metrics may take a while.