Fig. 1.
Download original image
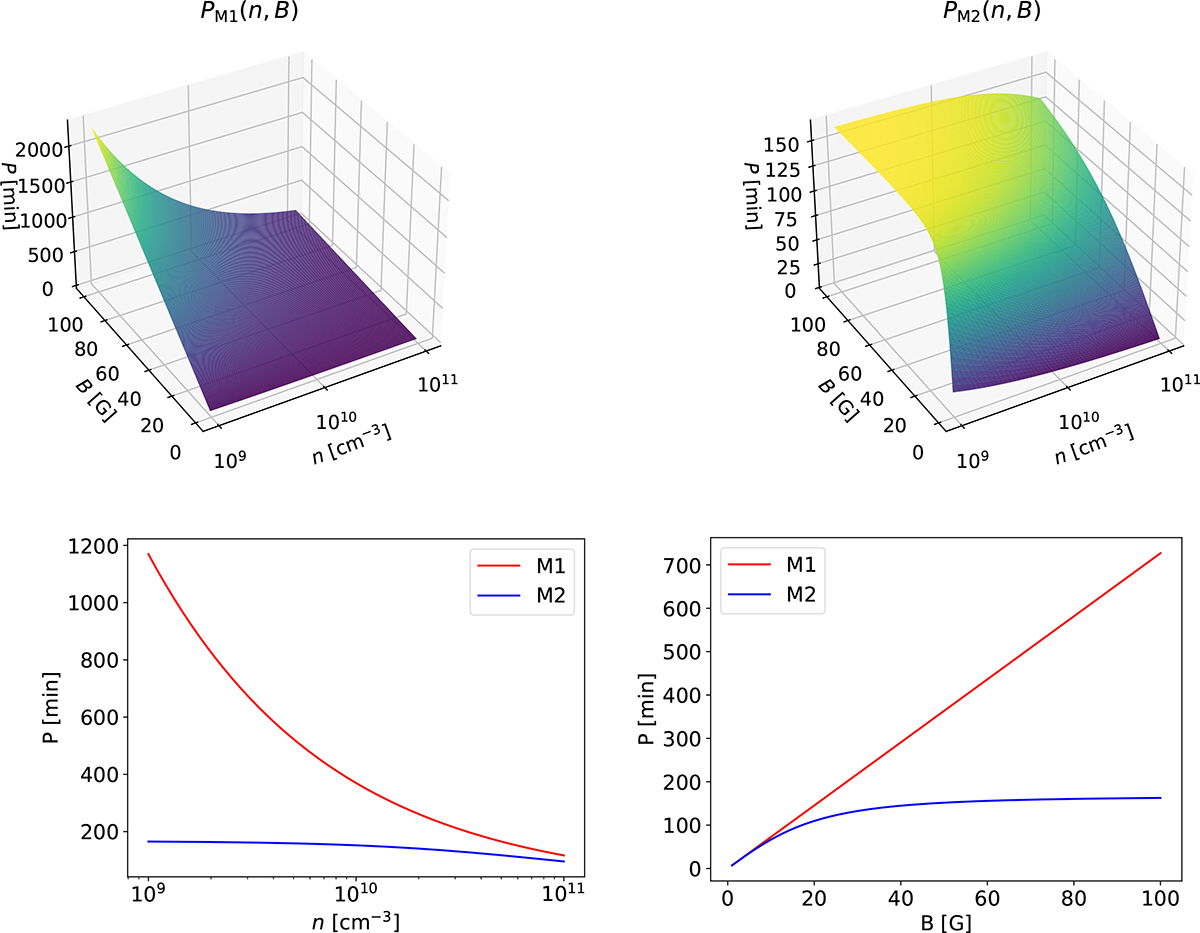
Top: Surface plots for the period of longitudinal oscillations under model M1 (left, given by Equation (4)) and model M2 (right, given by Equation (8)) as a function of particle density and magnetic field strength. Bottom: Cuts along a given value of magnetic field strength (left, B = 50 G) and particle density (right, n = 1010 cm−3). The solutions have been computed on a uniform 2D grid with Nn = NB = 800 points.
Current usage metrics show cumulative count of Article Views (full-text article views including HTML views, PDF and ePub downloads, according to the available data) and Abstracts Views on Vision4Press platform.
Data correspond to usage on the plateform after 2015. The current usage metrics is available 48-96 hours after online publication and is updated daily on week days.
Initial download of the metrics may take a while.