Fig. 5.
Download original image
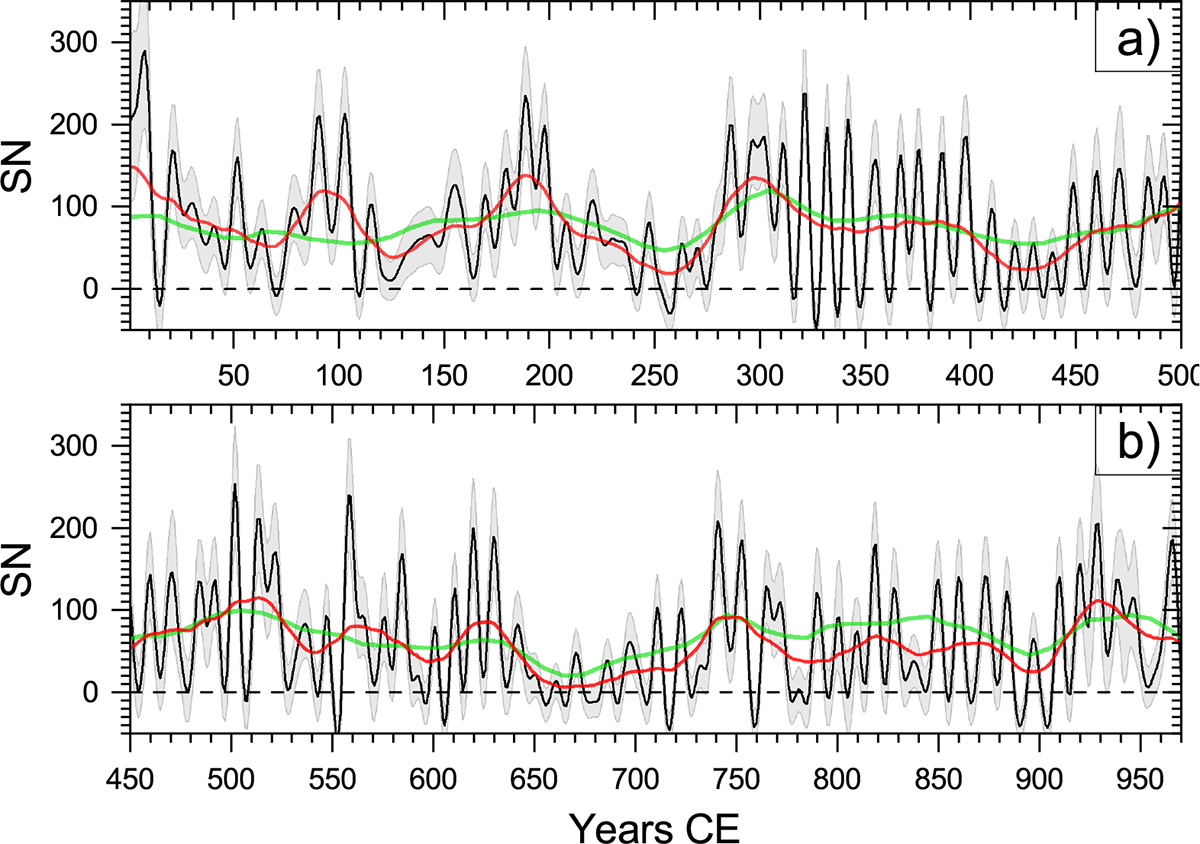
SNs (ISN_v2 normalisation) reconstructed here for 1–969 CE, split into two panels for clarity. The black curve, grey shading, and red curve depict the mean annual reconstructed SN, its 68% confidence interval, and the 22-year smoothed evolution (see main text), respectively. These data are identical to those in Fig. 1d. The digital version of these data is available at the CDS. The green curve depicts the smooth decadal SN values reconstructed from multi-proxy cosmogenic isotope data (Wu et al. 2018).
Current usage metrics show cumulative count of Article Views (full-text article views including HTML views, PDF and ePub downloads, according to the available data) and Abstracts Views on Vision4Press platform.
Data correspond to usage on the plateform after 2015. The current usage metrics is available 48-96 hours after online publication and is updated daily on week days.
Initial download of the metrics may take a while.