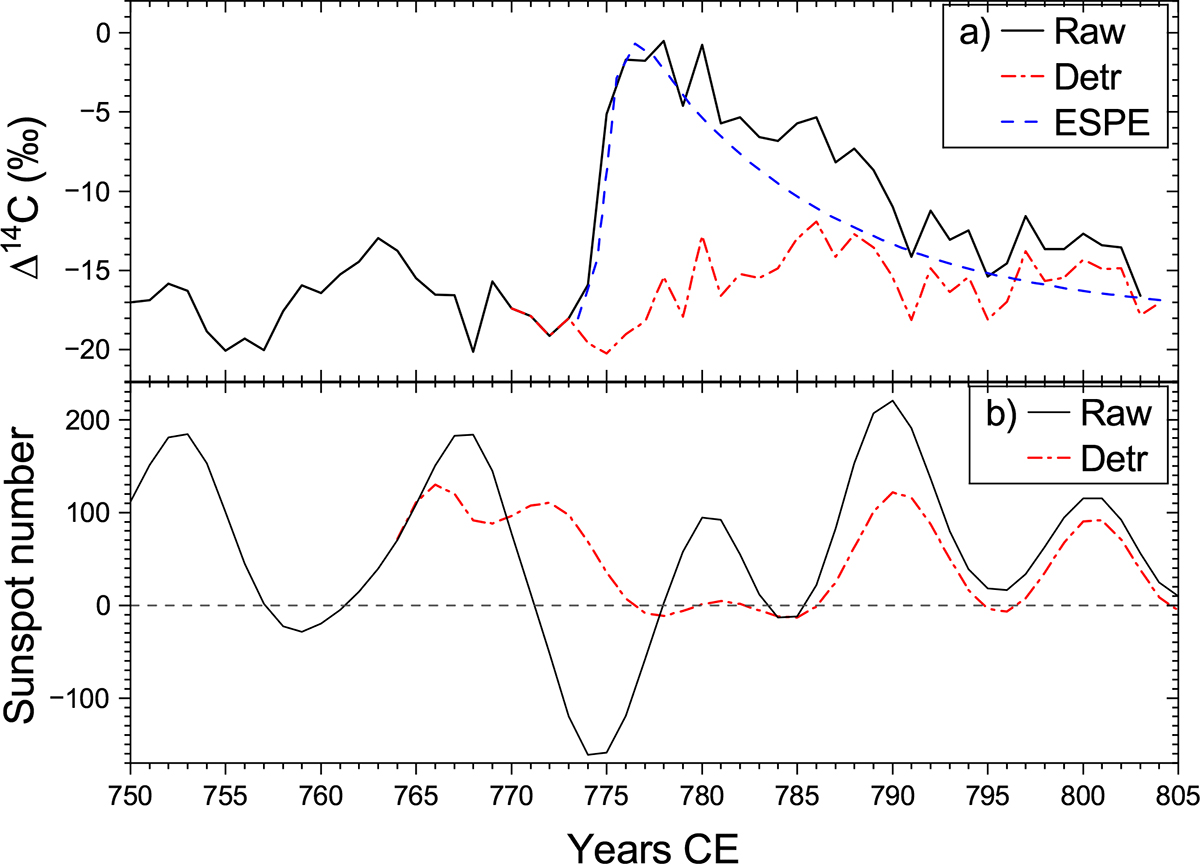
Fig. 3.
Download original image
Correction of the dataset for the ESPE of 774 CE. Panel (a): mean raw Δ14C annual data (black curve), the modelled 774 response (dashed blue lines; T = 130 DoY, A = 3.5; see Golubenko et al. 2025), and de-trended Δ14C data (dash-dotted red curve). Panel (b): SNs reconstructed from the raw Δ14C (black) and de-trended (red) datasets. Error bars are omitted for clarity in all panels.
Current usage metrics show cumulative count of Article Views (full-text article views including HTML views, PDF and ePub downloads, according to the available data) and Abstracts Views on Vision4Press platform.
Data correspond to usage on the plateform after 2015. The current usage metrics is available 48-96 hours after online publication and is updated daily on week days.
Initial download of the metrics may take a while.