Open Access
Fig. 9
Download original image
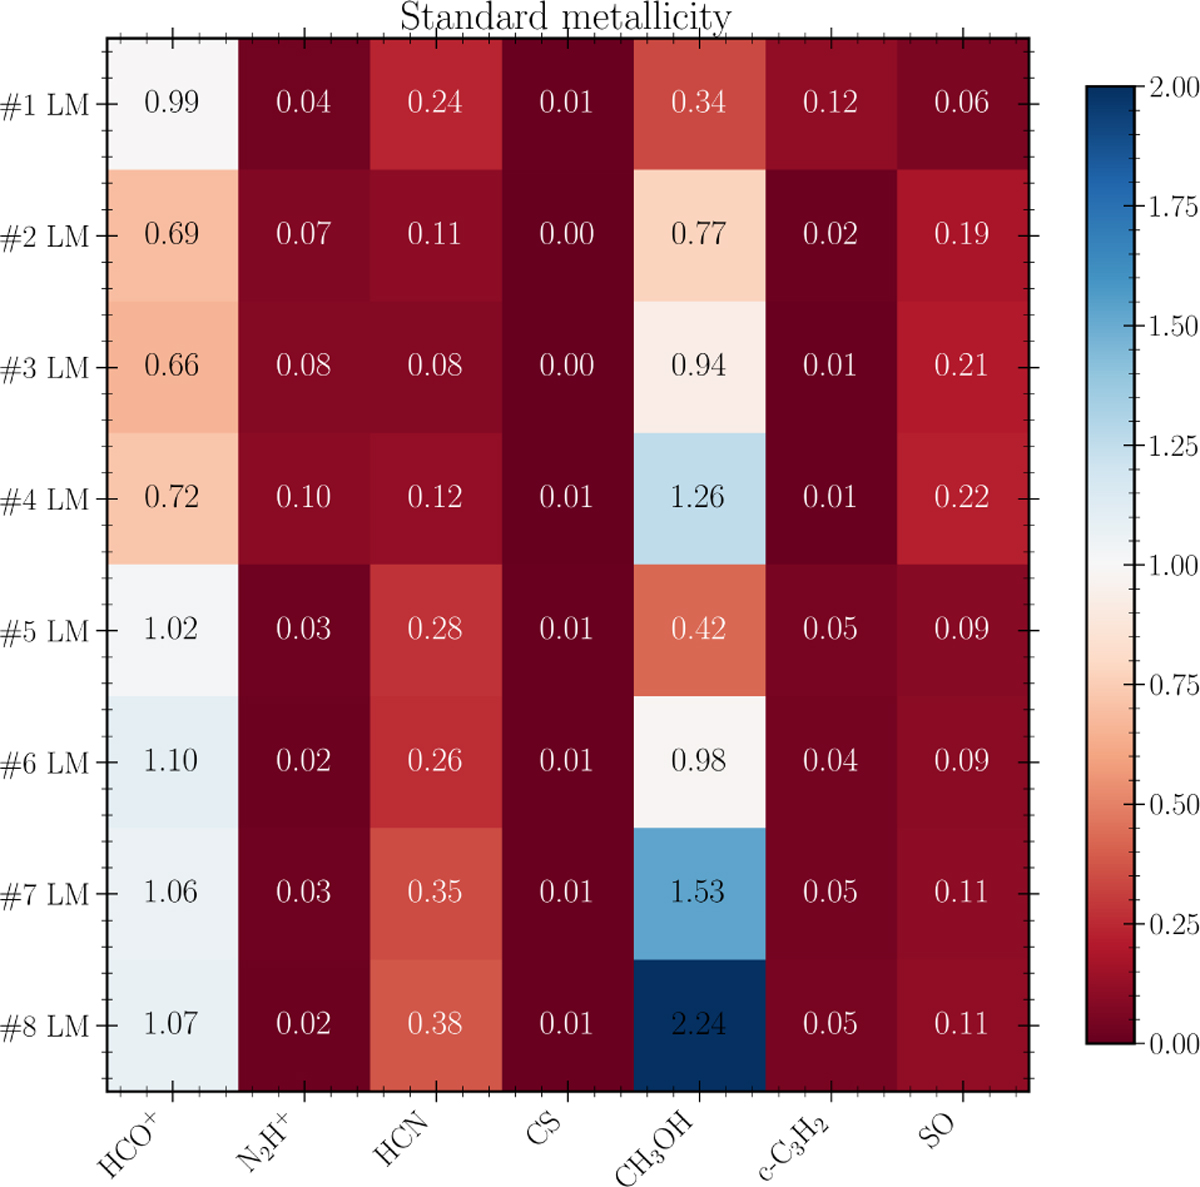
Comparison table for the peak intensity of the modeled emission lines toward L1544 (dust peak position) and toward the dust peak in the x-y plane. This figure shows the comparison for models with standard metallicities.
Current usage metrics show cumulative count of Article Views (full-text article views including HTML views, PDF and ePub downloads, according to the available data) and Abstracts Views on Vision4Press platform.
Data correspond to usage on the plateform after 2015. The current usage metrics is available 48-96 hours after online publication and is updated daily on week days.
Initial download of the metrics may take a while.