Fig. 4
Download original image
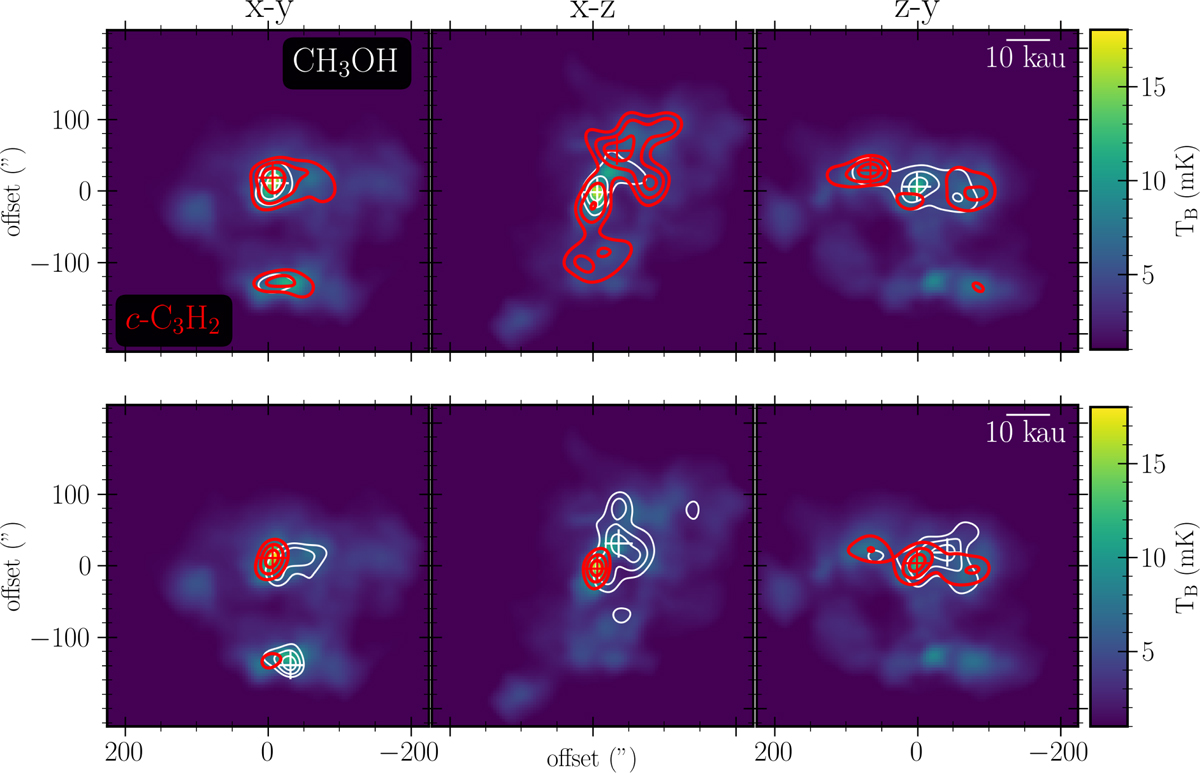
Comparison of the fiducial static model and the fiducial dynamic model, both with the updated network from this work. Top : static model with LM abundances. The contours show the integrated-intensity levels for CH3OH (white) and c-C3H2 (red) along the three principal axes of the simulation. The color map shows the continuum emission at 1.1 mm. Bottom : similar to the top panel but for dynamical model #7 LM.
Current usage metrics show cumulative count of Article Views (full-text article views including HTML views, PDF and ePub downloads, according to the available data) and Abstracts Views on Vision4Press platform.
Data correspond to usage on the plateform after 2015. The current usage metrics is available 48-96 hours after online publication and is updated daily on week days.
Initial download of the metrics may take a while.