Fig. 3
Download original image
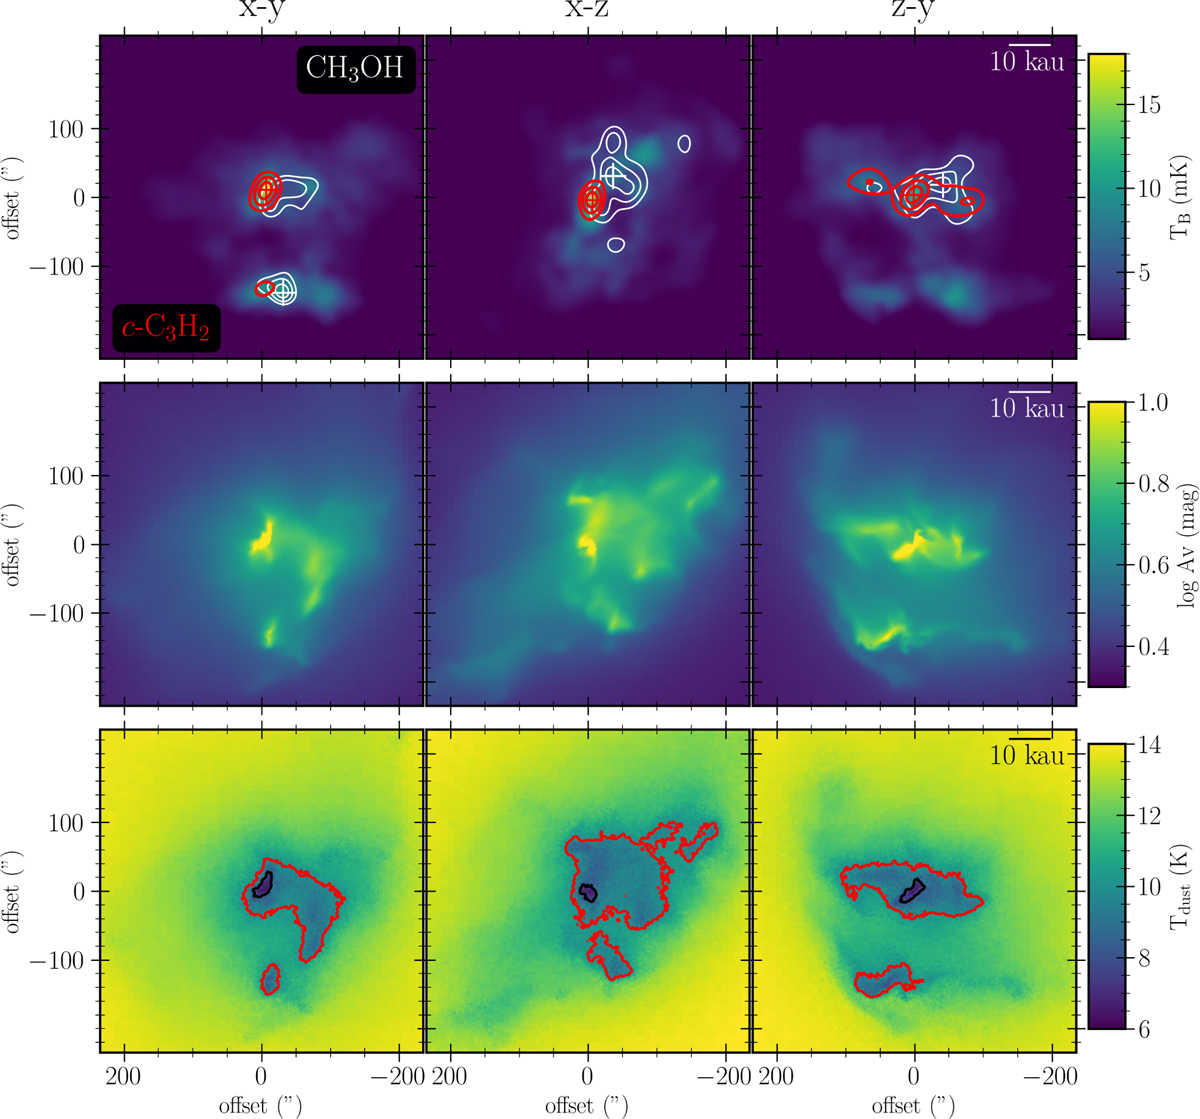
LM model with 106 yr static phase and ![]() = 2 mag (#3 LM). Top : integrated intensity levels for CH3 OH (white contours) and c-C3 H2 (red contours) along the three principal axes of the simulation. The color map shows the continuum emission at 1.1 mm. Middle : slice plot showing the local log Av,eff for each principal axes. The upper range of the color map is limited to 10 mag for clarity. Bottom : slice plot showing the local dust temperature for each principal axes. The red and black contours show the 10 K and 7 K limits, respectively.
= 2 mag (#3 LM). Top : integrated intensity levels for CH3 OH (white contours) and c-C3 H2 (red contours) along the three principal axes of the simulation. The color map shows the continuum emission at 1.1 mm. Middle : slice plot showing the local log Av,eff for each principal axes. The upper range of the color map is limited to 10 mag for clarity. Bottom : slice plot showing the local dust temperature for each principal axes. The red and black contours show the 10 K and 7 K limits, respectively.
Current usage metrics show cumulative count of Article Views (full-text article views including HTML views, PDF and ePub downloads, according to the available data) and Abstracts Views on Vision4Press platform.
Data correspond to usage on the plateform after 2015. The current usage metrics is available 48-96 hours after online publication and is updated daily on week days.
Initial download of the metrics may take a while.