Fig. 2
Download original image
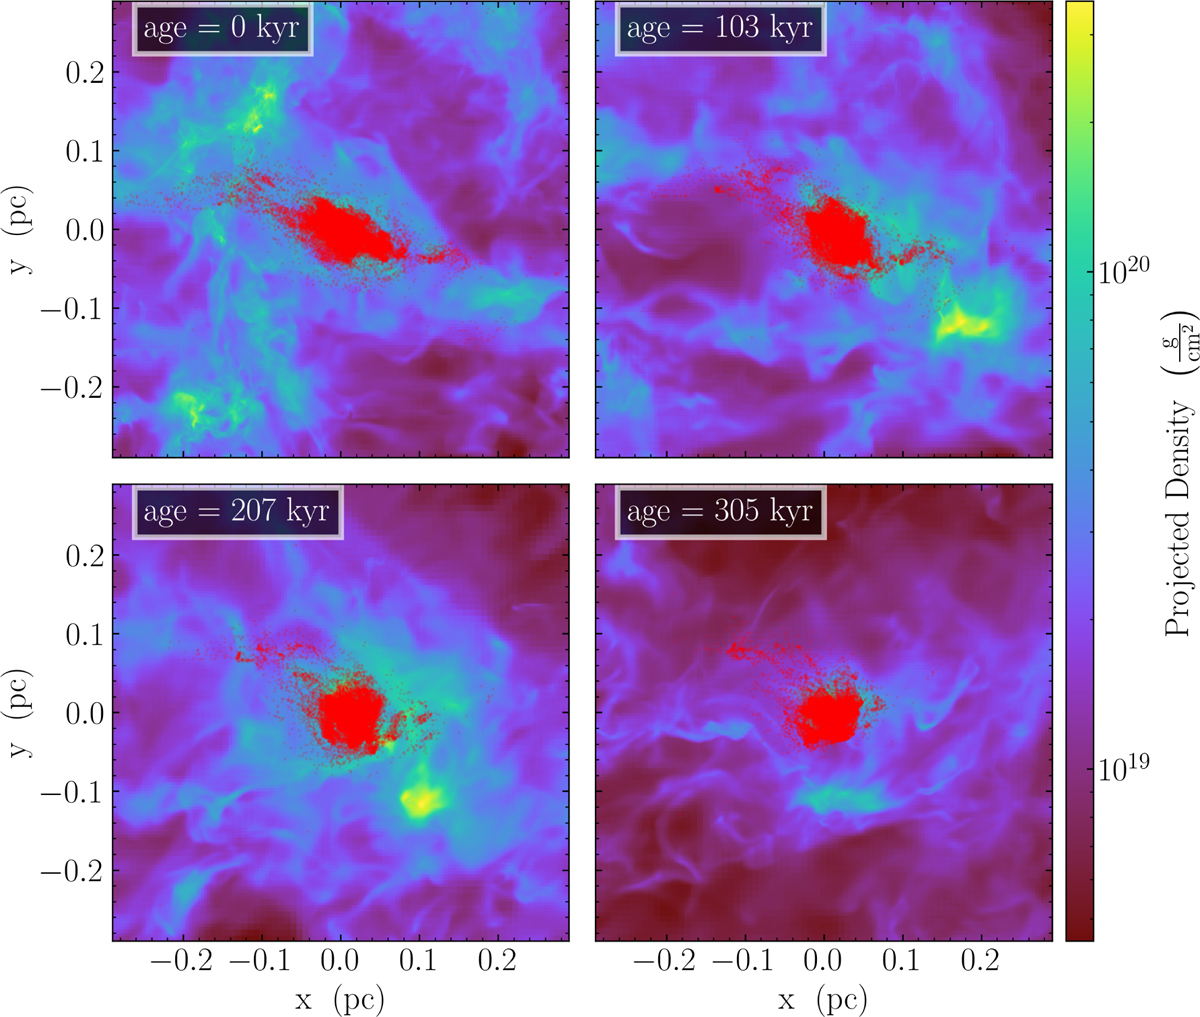
Four snapshots showing the accretion onto the pre-stellar core at different stages of the simulation. The red dots mark the position of the tracer particle accreted onto the pre-stellar core. Only 20% of the tracer particles are plotted for clarity. The color map shows the projected column density, similar to Fig. 1. Zero-age is defined as the onset of star formation in the simulation.
Current usage metrics show cumulative count of Article Views (full-text article views including HTML views, PDF and ePub downloads, according to the available data) and Abstracts Views on Vision4Press platform.
Data correspond to usage on the plateform after 2015. The current usage metrics is available 48-96 hours after online publication and is updated daily on week days.
Initial download of the metrics may take a while.