Fig. C.2
Download original image
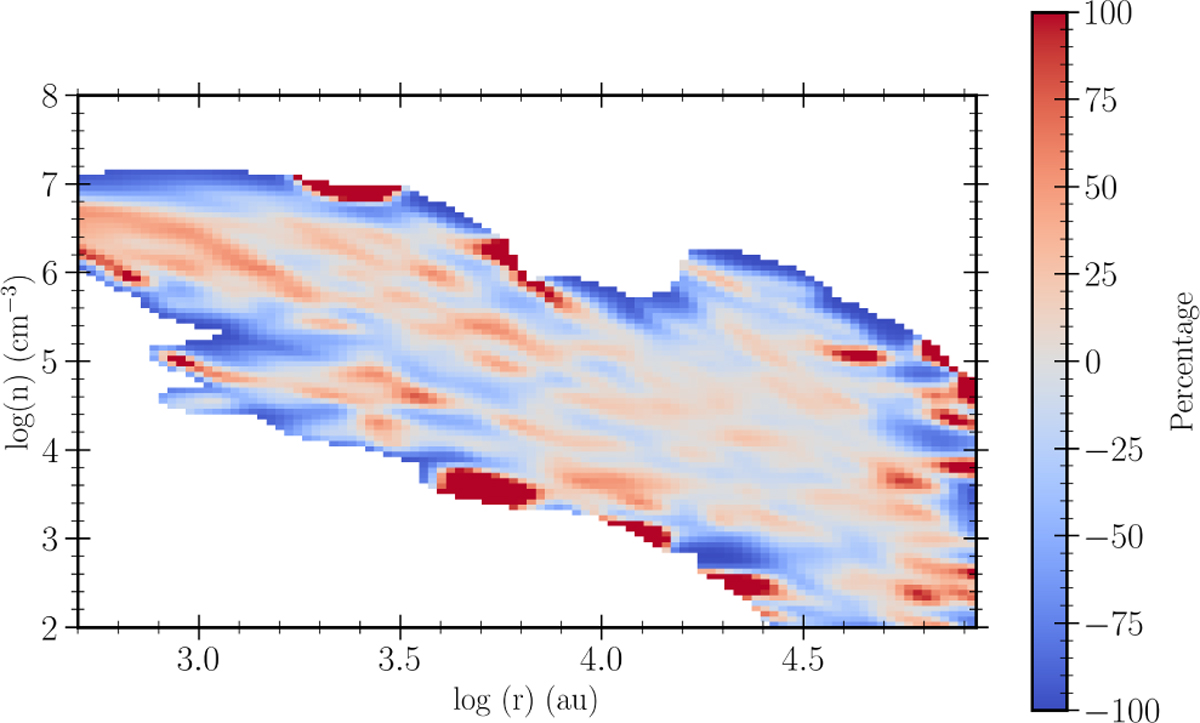
Deviation between the density structure of computational RAMSES grid and the density structure when interpolated from the ~20 000 tracer particles used in this study. The figure shows the deviation between the kernel density estimates for the density structure derived from either grid or tracer particles. Positive value indicate that the density derived from the tracer particles exceed the local grid value.
Current usage metrics show cumulative count of Article Views (full-text article views including HTML views, PDF and ePub downloads, according to the available data) and Abstracts Views on Vision4Press platform.
Data correspond to usage on the plateform after 2015. The current usage metrics is available 48-96 hours after online publication and is updated daily on week days.
Initial download of the metrics may take a while.