Fig. 1
Download original image
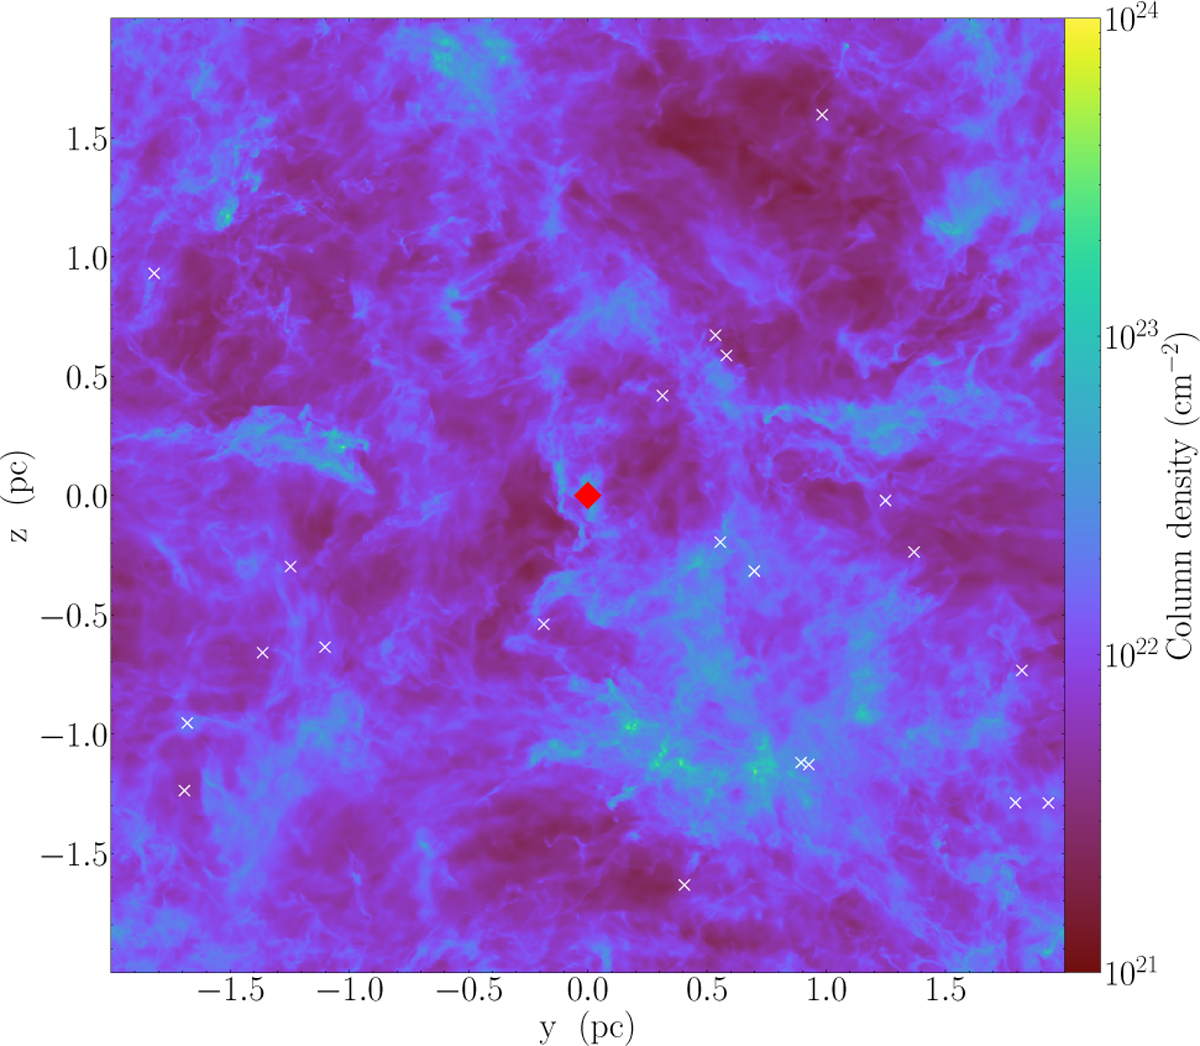
Projected H2 column densities in the molecular cloud simulation. The white crosses show the location of protostars formed in this snapshot from the simulation (t = 305 kyr). The red diamond marks the protostar that is studied here during the pre-stellar phase. The pre-stellar core studied in this work is centered in the figure for clarity because the box has periodic boundary conditions.
Current usage metrics show cumulative count of Article Views (full-text article views including HTML views, PDF and ePub downloads, according to the available data) and Abstracts Views on Vision4Press platform.
Data correspond to usage on the plateform after 2015. The current usage metrics is available 48-96 hours after online publication and is updated daily on week days.
Initial download of the metrics may take a while.