Fig. 4
Download original image
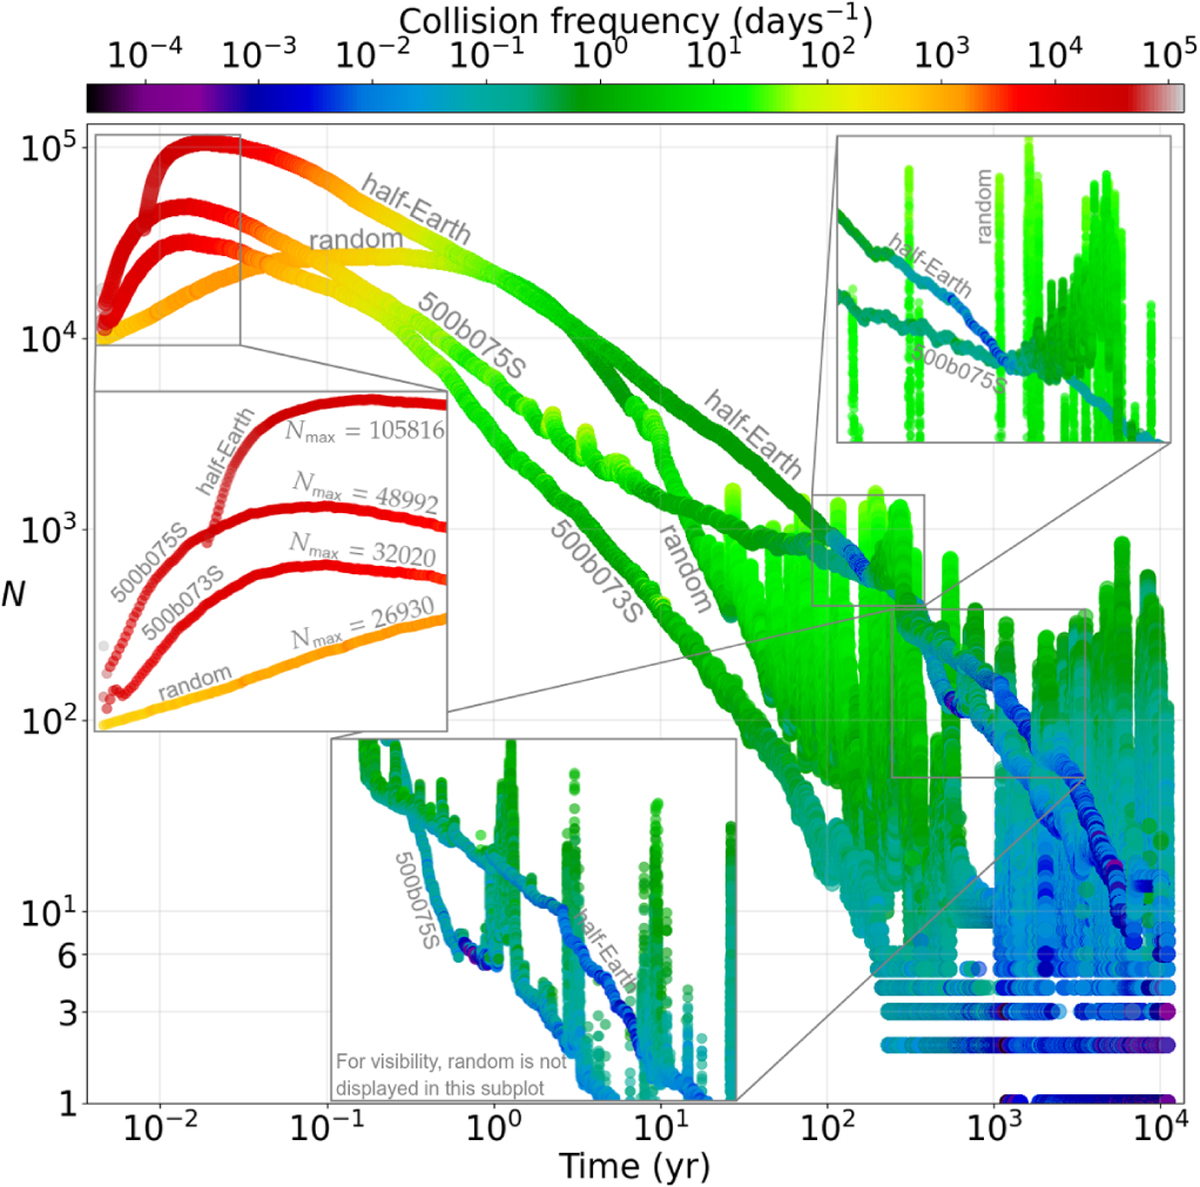
Number N of moonlets as a function of time. The color is the frequency of collisions in collisions per day. It takes into account all moonlets. Simulations ran until t = 11 000 years. All simulations reach N < 10 but fragmentations can then temporarily grow N back to a few hundreds, as is seen by the spikes. Zoom-in of unclear parts of the figure are shown.
Current usage metrics show cumulative count of Article Views (full-text article views including HTML views, PDF and ePub downloads, according to the available data) and Abstracts Views on Vision4Press platform.
Data correspond to usage on the plateform after 2015. The current usage metrics is available 48-96 hours after online publication and is updated daily on week days.
Initial download of the metrics may take a while.