Open Access
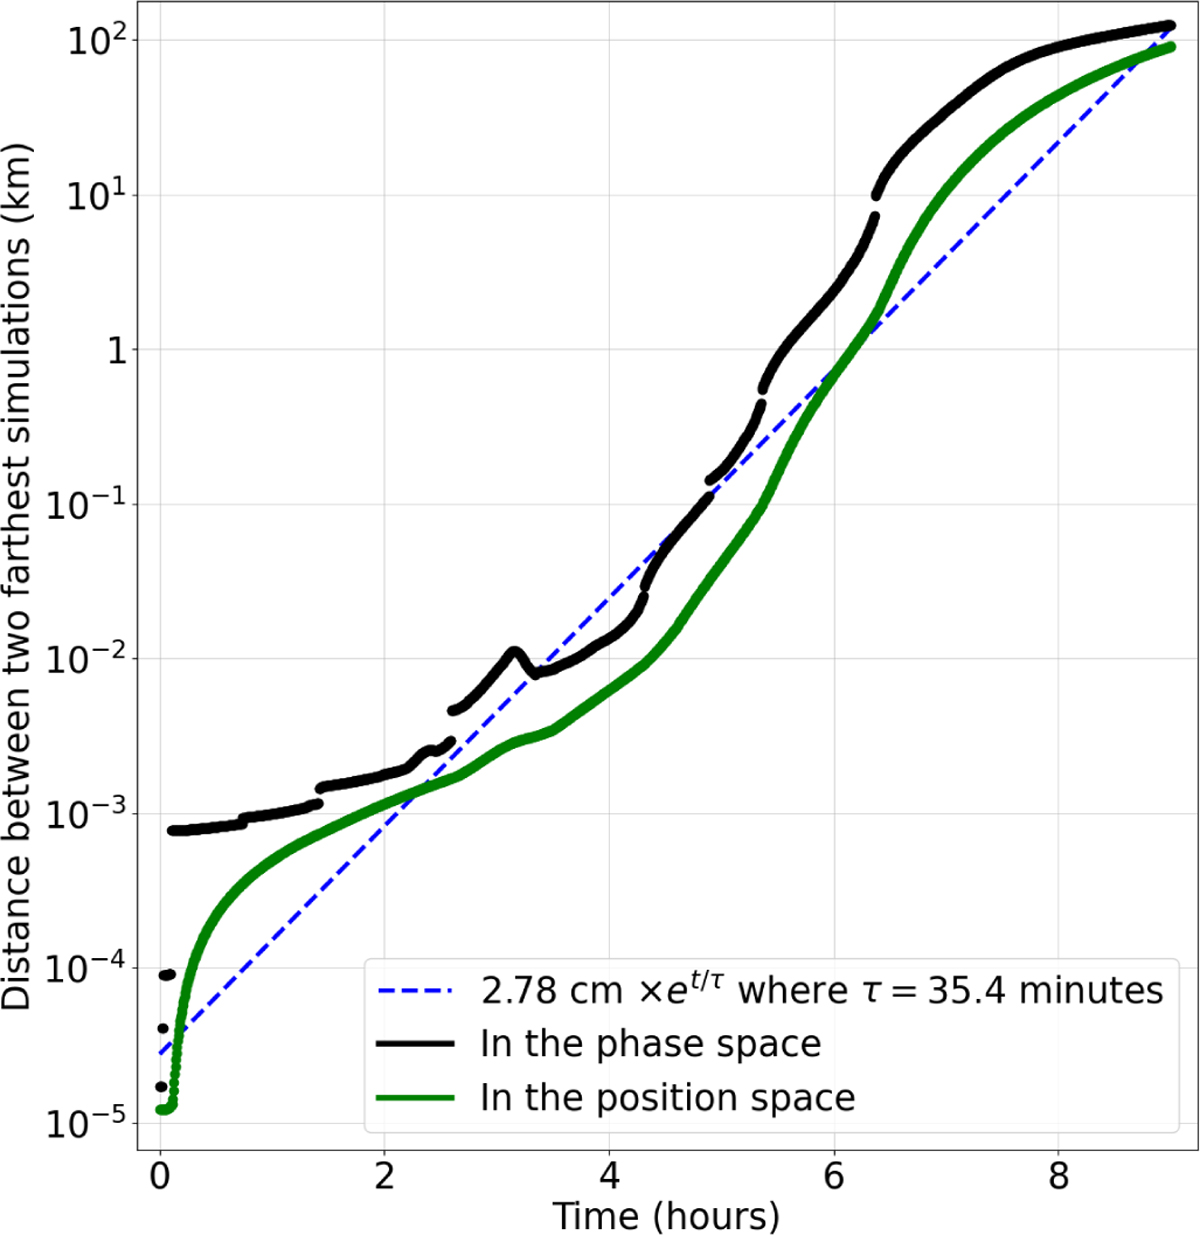
Fig. 2
Download original image
Distance between the two farthest simulations in the phase space and in the position space and best exponential fit. The discontinuities in the black curve come from elastic collisions. The exponential fits the green curve.
Current usage metrics show cumulative count of Article Views (full-text article views including HTML views, PDF and ePub downloads, according to the available data) and Abstracts Views on Vision4Press platform.
Data correspond to usage on the plateform after 2015. The current usage metrics is available 48-96 hours after online publication and is updated daily on week days.
Initial download of the metrics may take a while.