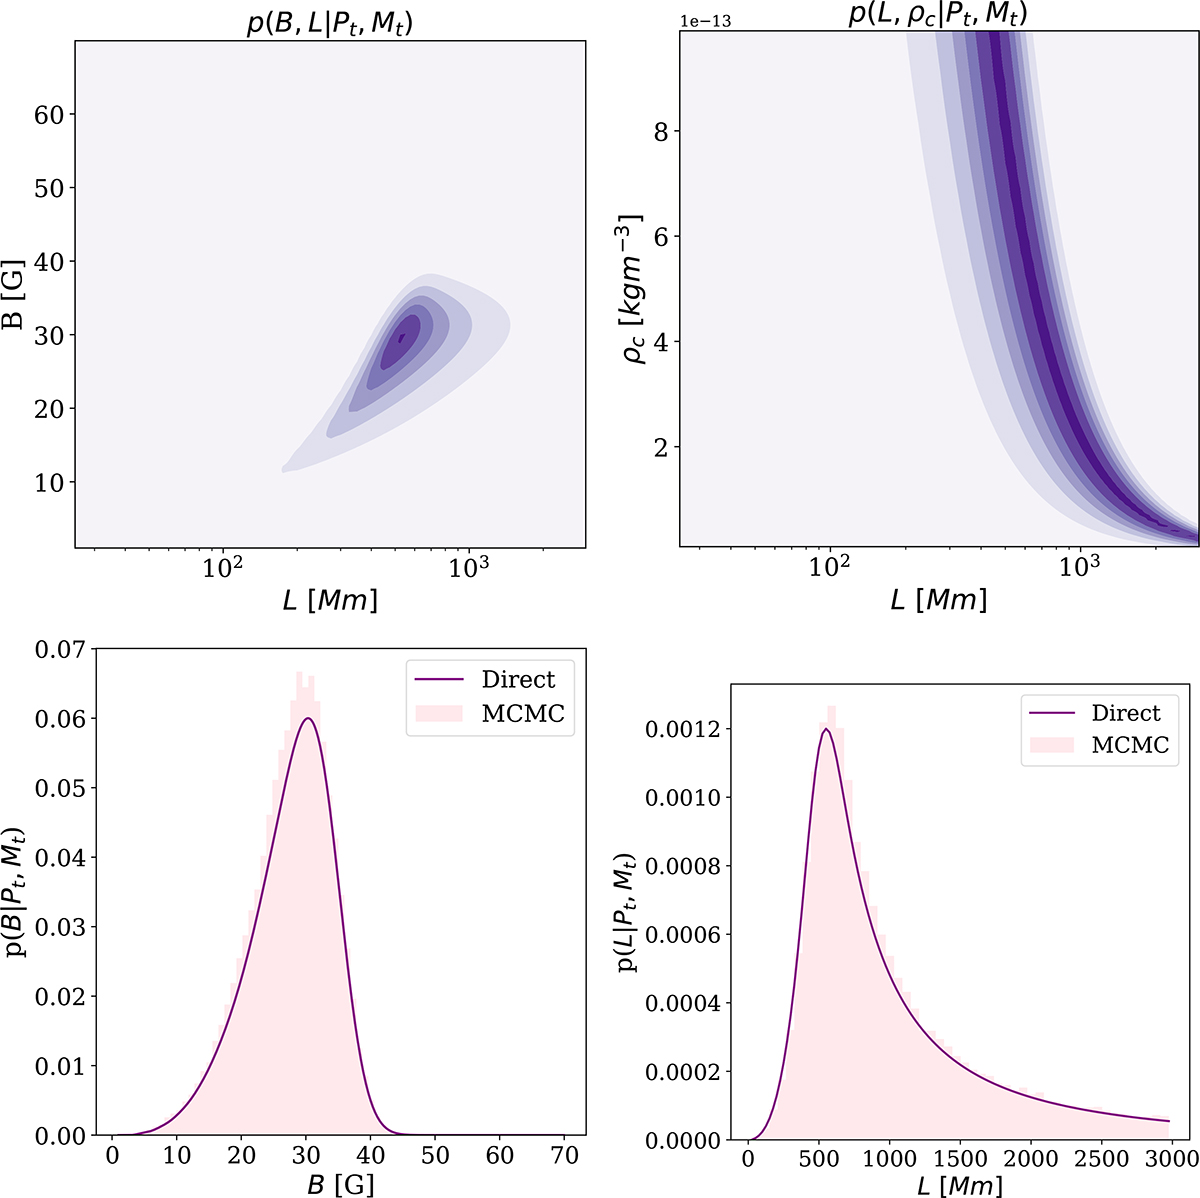
Fig. 3.
Download original image
Joint and marginal posterior distributions of flux-tube parameters. Top-left: Joint posterior distribution of magnetic field strength and flux-tube length. Top-right: Joint distribution of density and flux-tube length. Bottom-left: Marginal distribution of the magnetic field. Bottom-right: Marginal distribution of the flux-tube length, assuming uniform priors for all parameters and using the observational constraints of Mazumder et al. (2020). The prior on the magnetic field is taken from the posterior obtained in Sect. 3.1 using the uniform prior (Bu). The purple curves denote marginal posterior distributions obtained via Bayesian inference, while the pink histograms correspond to results from the emcee MCMC algorithm with the same dimensionality, number of walkers, steps, and burn-in phase as in Fig. 1. The bottom panels are not normalised 1.
Current usage metrics show cumulative count of Article Views (full-text article views including HTML views, PDF and ePub downloads, according to the available data) and Abstracts Views on Vision4Press platform.
Data correspond to usage on the plateform after 2015. The current usage metrics is available 48-96 hours after online publication and is updated daily on week days.
Initial download of the metrics may take a while.