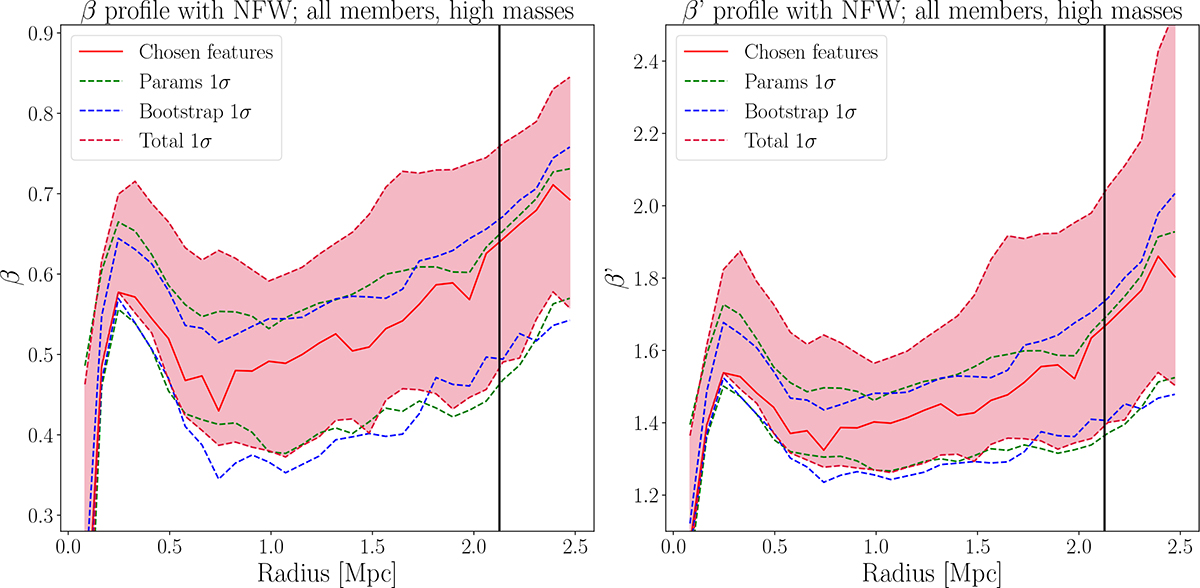
Fig. C.2.
Download original image
Dissection of the JI confidence intervals for the whole HM galaxy population (see Sect. 7.4.1). The dashed green lines represent the systematic uncertainty, while the dashed blue lines represent the uncertainty from bootstrapping both N(R) and σlos(R). The dashed red lines and the red shaded region mark the overall 1σ confidence interval. The vertical black line represents the R200c of the stacked cluster.
Current usage metrics show cumulative count of Article Views (full-text article views including HTML views, PDF and ePub downloads, according to the available data) and Abstracts Views on Vision4Press platform.
Data correspond to usage on the plateform after 2015. The current usage metrics is available 48-96 hours after online publication and is updated daily on week days.
Initial download of the metrics may take a while.