Fig. A.4
Download original image
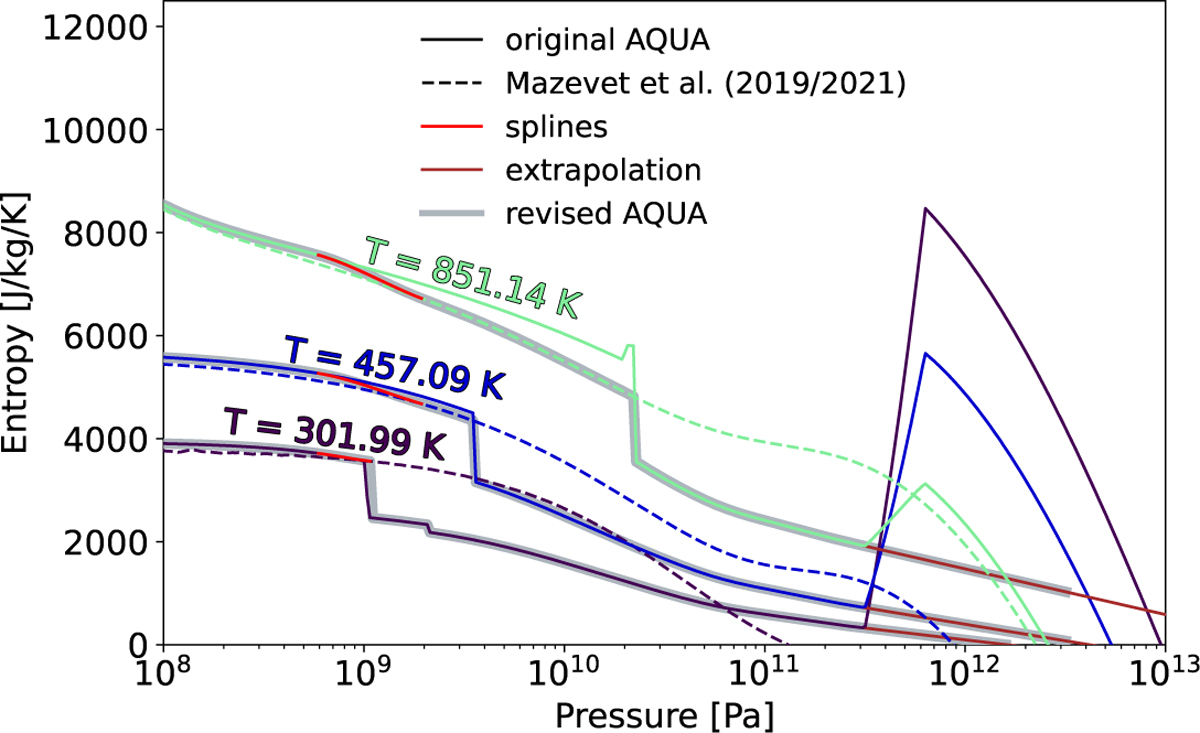
Construction of isotherms around the liquid- and supercritical-to-ice VII transition for temperatures between 300 K and 1000 K. Isotherms within this range cross from region 4 to region 7 through an interpolation region from 5.8 · 108 Pa to 2 · 109 Pa, except the 301.99 K case which goes up to P4-to-3 (the boundary marking the transition from region 4 to ice VI in region 2). Across the interpolation region, a cubic spline (shown in red) was used to connect the original AQUA isotherm (solid lines) to the new data from Mazevet et al. (2021) (dashed lines) with the +425 J/(kg K) shift applied. After the spline, the Mazevet et al. (2021) data is followed by the isotherms at 457.98, 851.14 until the boundary between region 7 and region 3 is met, which occurs at 3.53 · 109 Pa, 2.23 · 1010 Pa. After this boundary, the original AQUA is followed again until 3 · 1011 Pa, after which the isotherms are linearly extrapolated (brown lines). The grey curves show the final, revised isotherms.
Current usage metrics show cumulative count of Article Views (full-text article views including HTML views, PDF and ePub downloads, according to the available data) and Abstracts Views on Vision4Press platform.
Data correspond to usage on the plateform after 2015. The current usage metrics is available 48-96 hours after online publication and is updated daily on week days.
Initial download of the metrics may take a while.