Fig. A.3
Download original image
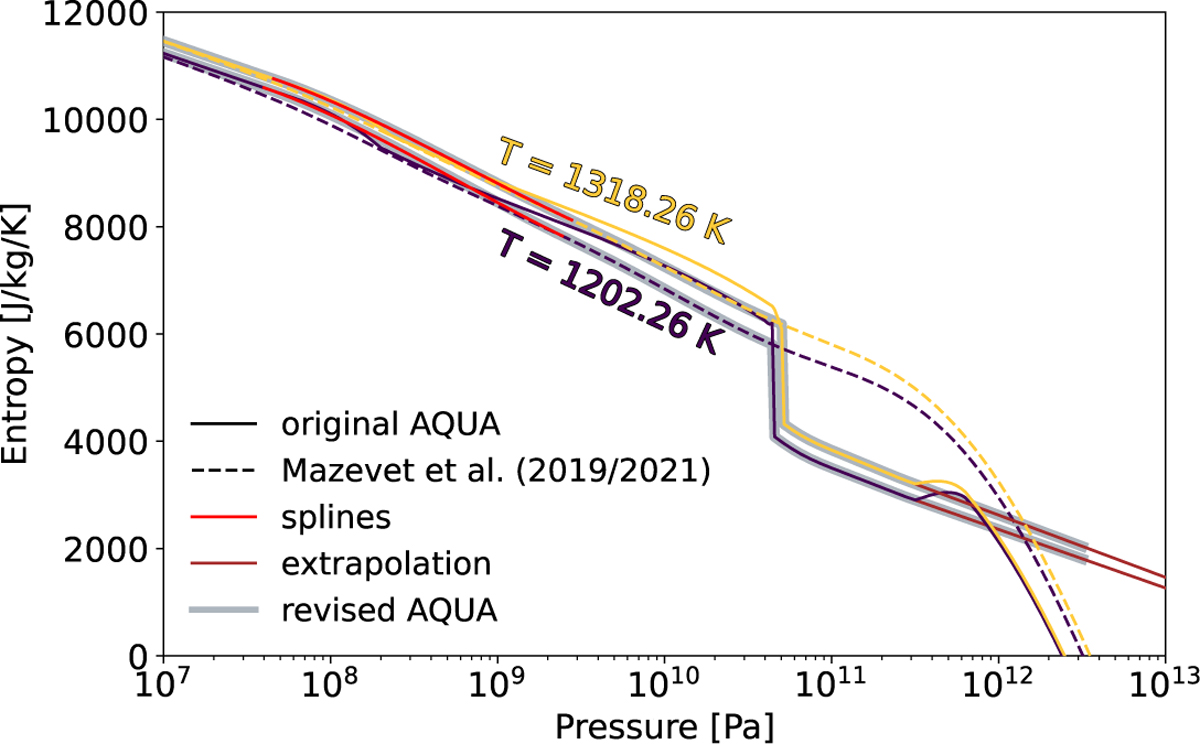
Construction of isotherms around the fluid-to-ice X transition for temperatures between 1200 K and 1320 K. Isotherms cross from region 6 to region 7 through an interpolation region ranging from 0.6·P6-to7 Pa to 38·P6-to7 Pa. Across the interpolation region, a cubic spline (shown in red) was used to connect the original AQUA isotherm (solid lines) to the new data from Mazevet et al. (2021) (dashed lines) with the +425 J/(kg K) shift applied. These isotherms follow Mazevet et al. (2021) after the spline until the boundary between region 7 and region 3 is met, which occurs at 4.49 · 1010 Pa for 1202.26 K and at 5.12 · 1010 Pa for 1318.26 K. After that boundary, the isotherms follow the original AQUA again up to 3 · 1011 Pa and then the linear extrapolation (brown lines). The grey curves show the final, revised isotherms.
Current usage metrics show cumulative count of Article Views (full-text article views including HTML views, PDF and ePub downloads, according to the available data) and Abstracts Views on Vision4Press platform.
Data correspond to usage on the plateform after 2015. The current usage metrics is available 48-96 hours after online publication and is updated daily on week days.
Initial download of the metrics may take a while.