Fig. A.1
Download original image
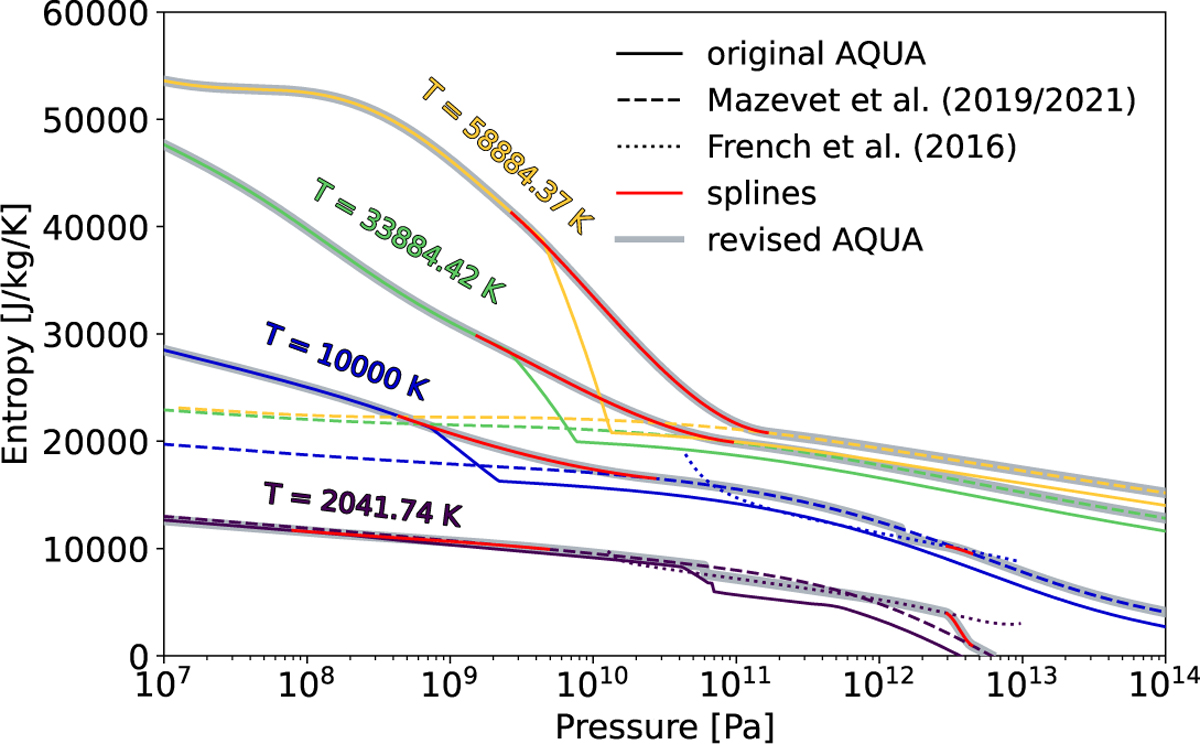
Construction of isotherms around the fluid-to-SI transition for temperatures between 2000 K and 6 · 104 K. Isotherms for T > 2000 K cross from region 6 to region 7 through an interpolation region ranging from 0.6·P6-to7 Pa to 38·P6-to-7 Pa. Across the interpolation region, a cubic spline (shown in red) was used to connect the original AQUA isotherm (solid lines) to the new data from Mazevet et al. (2021) (dashed lines) with the +425 J/(kg K) shift applied. The 2041.74 K and 10000 K follow the Mazevet et al. (2021) data until the boundary between region 7 and region 5 is met. For the 2041.74 K case, this occurs at 6.08 · 1010 Pa. For the 10000 K isotherm, this is at 1.40 · 1012 Pa. At these pressures, the isotherms stop following the Mazevet et al. (2021) data and begin following French et al. (2016) (dotted lines). This occurs up to 2.88 · 1012 Pa, where a new spline until 4.47 · 1012 Pa is applied to transition from French et al. (2016) back to Mazevet et al. (2021). Isotherms at 33884.42 K and 58884.37 K simply have the spline showing the transition from region 6 to 7 applied, and then continue following Mazevet et al. (2021). The grey curves show the final, revised isotherms.
Current usage metrics show cumulative count of Article Views (full-text article views including HTML views, PDF and ePub downloads, according to the available data) and Abstracts Views on Vision4Press platform.
Data correspond to usage on the plateform after 2015. The current usage metrics is available 48-96 hours after online publication and is updated daily on week days.
Initial download of the metrics may take a while.