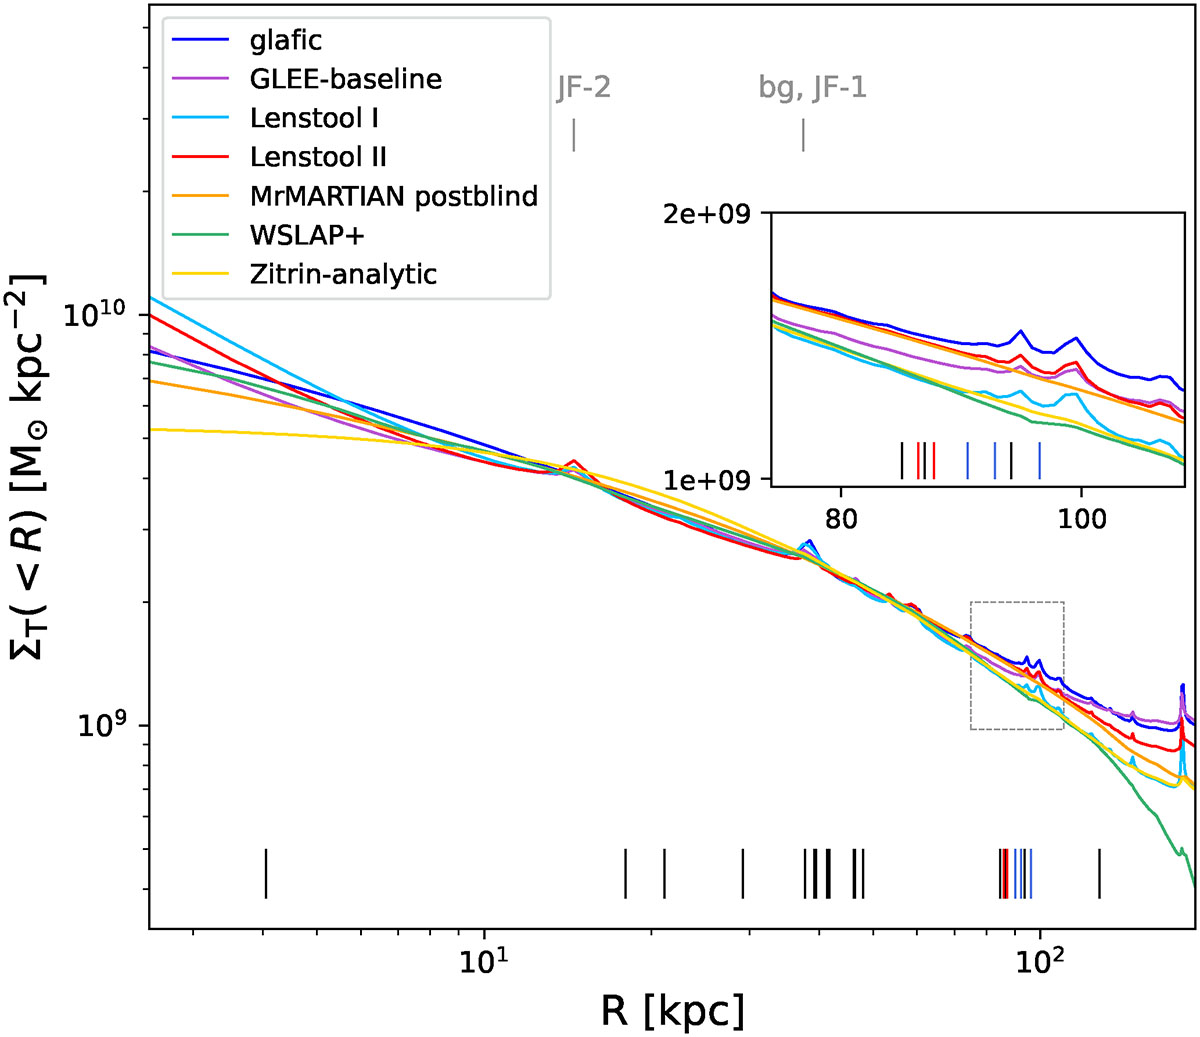
Fig. 2.
Download original image
Total average surface-mass-density profiles of MACS J0138−2155 as a function of projected distance from the BCG center for the different best-fit strong-lensing models. The vertical lines (at the bottom of the panel) show the observed positions of the 23 multiple images in the gold sample, where the positions of the multiple images of SN Encore and SN Requiem are highlighted in red and blue, respectively. The vertical gray lines (at the top of the panel) mark the positions of the JF-1, JF-2, and bg galaxies, which contribute significantly to the surface mass density at their locations in some models. The inset shows a zoom-in of the region delimited by the dashed rectangle, where the observed multiple images of the two SNe are located.
Current usage metrics show cumulative count of Article Views (full-text article views including HTML views, PDF and ePub downloads, according to the available data) and Abstracts Views on Vision4Press platform.
Data correspond to usage on the plateform after 2015. The current usage metrics is available 48-96 hours after online publication and is updated daily on week days.
Initial download of the metrics may take a while.