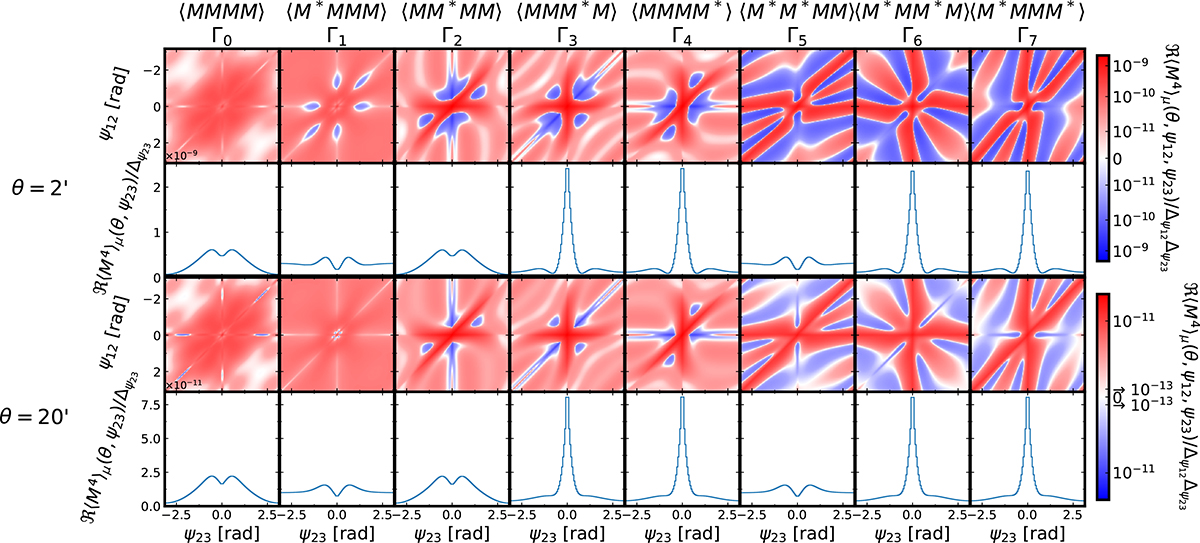
Fig. 3.
Download original image
Integrand for the eight complex aperture measures once the radial integration is performed (first and third rows) and once all but one angular integral are performed (second and fourth rows), computed on 126 radial bins and 113 angular bins. At small aperture radii, θ = 2 ′ (top two rows), we find a higher signal, while at large aperture radii, θ = 20 ′ (bottom two rows), the signal is more strongly peaked around the zero-angles. The peaks from the one-dimensional profiles correspond to close-by mixed-pair configurations, which play a stronger role for large θ, thus resulting in a smaller region of relative high values in the bottom rows. Similar peaks as in the integral over Γ2, Γ3, Γ6, and Γ7 can be found for the integral over Γ4 and Γ5 by projecting onto another angle (ψ23 or ψ12 + ψ23). The integrals over Γ0 and Γ1 are smoother, so a faster convergence with binning accuracy is expected. The color bars are in Symlog scale (Hunter 2007), i.e. in logarithmic scale for large absolute values and linear scale for values around 0, with the linear threshold 170 times lower than the maximum for each aperture.
Current usage metrics show cumulative count of Article Views (full-text article views including HTML views, PDF and ePub downloads, according to the available data) and Abstracts Views on Vision4Press platform.
Data correspond to usage on the plateform after 2015. The current usage metrics is available 48-96 hours after online publication and is updated daily on week days.
Initial download of the metrics may take a while.