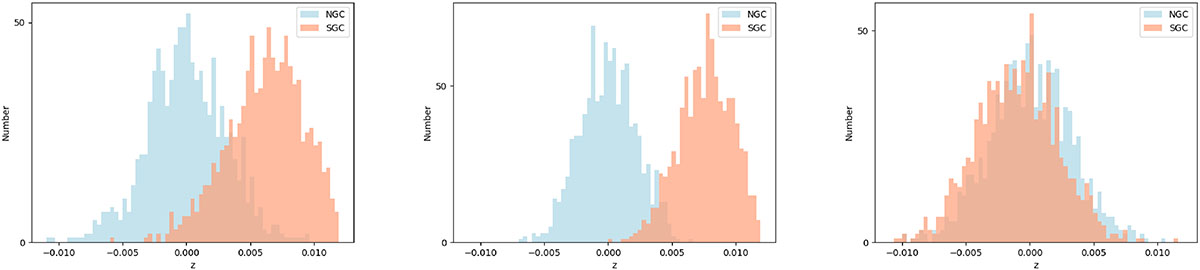
Fig. 3.
Download original image
Assessment of NGC and SGC systematic differences via bootstrap resampling. For each QSO sample (left: eBOSS DR14; centre: eBOSS DR16; right: DESI DR1), we repeatedly (1000 times) drew bootstrap resamples of 28 000 data points from each hemisphere’s dataset, computing the mean redshift for each resample. The distributions of these resampled means are plotted as histograms with a bin width of 0.000333. The y-axis represents the count of resamples whose mean redshift falls within the corresponding bin. All distributions are plotted relative to the average redshift of the total NGC dataset (vertical line at zero). The x-axis shows the redshift difference Δz (dimensionless) relative to the total NGC mean. The offset between the NGC (centred) and SGC distributions indicates a hemisphere-level systematic discrepancy. The amplitude of this offset (∼0.008 for eBOSS, ∼0.001 for DESI) is comparable to the expected kinematic dipole signal (β = v/c ∼ 10−3), necessitating separate hemispheric analysis (Section 3.3).
Current usage metrics show cumulative count of Article Views (full-text article views including HTML views, PDF and ePub downloads, according to the available data) and Abstracts Views on Vision4Press platform.
Data correspond to usage on the plateform after 2015. The current usage metrics is available 48-96 hours after online publication and is updated daily on week days.
Initial download of the metrics may take a while.