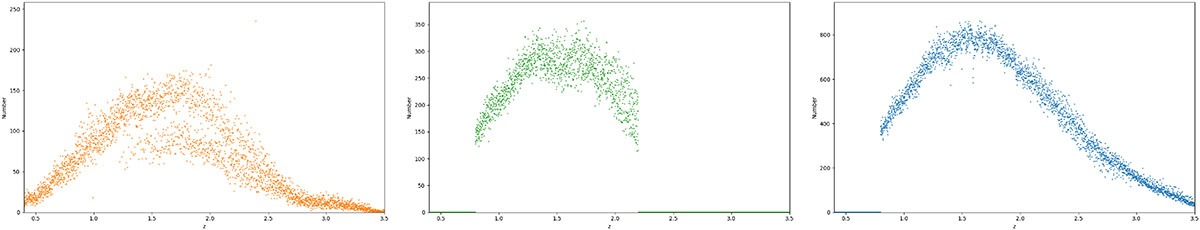
Fig. 1.
Download original image
Redshift distributions of the QSO catalogues. Left to right: eBOSS DR14 (orange), eBOSS DR16 (green), and DESI DR1 (blue). The DR14 distribution is broad (0.4 < z < 8) but sparse at the extremes; we use the well-populated range 0.4 < z < 2.8. The DESI DR1 distribution spans 0.8 < z < 3.5; we use 0.8 < z < 3.0 to avoid edge effects. All histograms use a bin width of Δz = 0.001. Note that the y-axis scales differ between panels. The primary overlap region for the eBOSS samples is 0.8 < z < 2.2, while DESI significantly overlaps in the range 0.8 < z < 2.3.
Current usage metrics show cumulative count of Article Views (full-text article views including HTML views, PDF and ePub downloads, according to the available data) and Abstracts Views on Vision4Press platform.
Data correspond to usage on the plateform after 2015. The current usage metrics is available 48-96 hours after online publication and is updated daily on week days.
Initial download of the metrics may take a while.