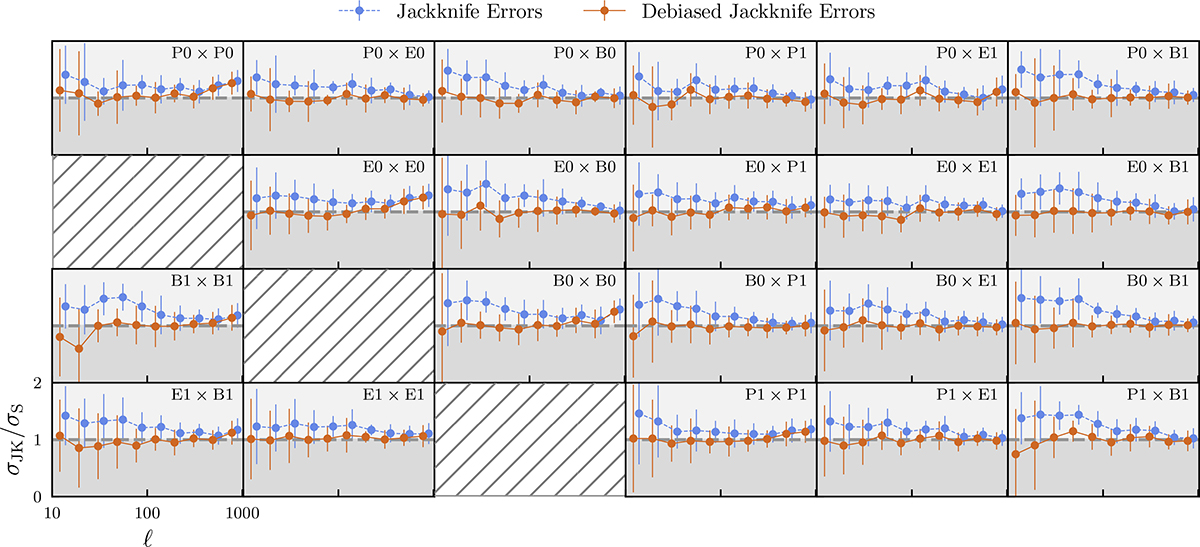
Fig. 7.
Download original image
The standard deviation for the jackknife and debiased jackknife estimates of the covariance σJK, for NJK = 74, are compared to the sample covariance. The lines and error bars represent the mean and spread across ten realisations. See Fig. A.2 for details on the subplot layout. Debiasing removes the bias towards high diagonal components in the jackknife covariance.
Current usage metrics show cumulative count of Article Views (full-text article views including HTML views, PDF and ePub downloads, according to the available data) and Abstracts Views on Vision4Press platform.
Data correspond to usage on the plateform after 2015. The current usage metrics is available 48-96 hours after online publication and is updated daily on week days.
Initial download of the metrics may take a while.