| Issue |
A&A
Volume 707, March 2026
|
|
|---|---|---|
| Article Number | A84 | |
| Number of page(s) | 16 | |
| Section | Stellar structure and evolution | |
| DOI | https://doi.org/10.1051/0004-6361/202557910 | |
| Published online | 27 February 2026 | |
Drawing the line between explosion and collapse in electron-capture supernovae
I. Impact of conductive flame speeds and ignition conditions on the explosion mechanism
1
Heidelberger Institut für Theoretische Studien Schloss-Wolfsbrunnenweg 35 69118 Heidelberg, Germany
2
Theoretical Division, Los Alamos National Laboratory Los Alamos NM 87545, US
3
Zentrum für Astronomie der Universität Heidelberg, Institut für Theoretische Astrophysik Philosophenweg 12 69120 Heidelberg, Germany
4
Max-Planck-Institut für Astrophysik Karl-Schwarzschild-Str. 1 85748 Garching, Germany
5
Astrophysics Research Centre, Lennard-Jones Laboratories, Keele University Keele ST5 5BG, UK
6
Kavli IPMU (WPI), The University of Tokyo 5-1-5 Kashiwanoha Kashiwa 277-8583, Japan
7
Department of Astronomy and Theoretical Astrophysics Center, University of California Berkeley CA 94720, USA
★ Corresponding author: This email address is being protected from spambots. You need JavaScript enabled to view it.
Received:
30
October
2025
Accepted:
20
January
2026
Abstract
Context. Electron-capture supernovae (ECSNe) are commonly thought to result in a collapse to a neutron star. Recent work has shown that, under certain conditions, a thermonuclear explosion is also a possible outcome. The division between the two regimes, however, has not yet been mapped out.
Aims. In this study, we investigate the conditions under which the transition from thermonuclear explosion to collapse occurs, and what physical mechanisms drive each outcome.
Methods. We conducted a parameter study of 56 3D hydrodynamic simulations of ECSN in ONe white dwarfs using a level set based flame model implemented in the LEAFS code. We varied both the ignition location and the central density at ignition to determine the conditions of the transition regime. Additionally, we explored two different laminar flame parameterizations and how they impact the simulation outcome.
Results. From our parameter study, we find a transition density in the range of log ρcini = 10.0 and 10.15 g cm−3, depending on the ignition location and utilized laminar flame speed parameterization. Importantly, we find that for sufficiently high central densities, the burned ashes can sink into the core and trap large amounts of neutron-rich material in the bound remnant. In the transition regime between explosion and collapse, we find that the laminar flame speed plays a critical role by suppressing the formation of instabilities and thereby reducing the nuclear energy generation needed to overcome the collapse.
Conclusions. We find that a thermonuclear explosion is possible for a wide range of parameters, whereby a more off-center ignition allows for higher central densities to still result in an explosion. Both the conditions at ignition and the flame physics are critical in determining the outcome. Detailed 3D hydrodynamic simulations of the preceding stellar evolution and the ignition process of the thermonuclear flame are necessary to accurately predict the outcome of ECSNe.
Key words: hydrodynamics / stars: AGB and post-AGB / stars: neutron / supernovae: general / white dwarfs
The NuGrid collaboration.
© The Authors 2026
 Open Access article, published by EDP Sciences, under the terms of the Creative Commons Attribution License (https://creativecommons.org/licenses/by/4.0), which permits unrestricted use, distribution, and reproduction in any medium, provided the original work is properly cited.
This article is published in open access under the Subscribe to Open model. This email address is being protected from spambots. You need JavaScript enabled to view it. to support open access publication.
1. Introduction
After decades of research, the explosive death of most stars has been well explored. While the most massive stars (≳12 M⊙) end their lives in an iron core-collapse supernova (FeCCSN), collapsing under their own weight and resulting in the formation of either a neutron star (NS) or a black hole (BH), stars at the lighter end of the mass spectrum (≲8 M⊙) will form a white dwarf (WD) star. WDs are typically stable objects when they evolve in an isolated environment, but when interacting with a companion star, the interaction can trigger a thermonuclear explosion commonly known as Type Ia supernova (SN Ia; Whelan & Iben 1973; Iben & Tutukov 1984). Although there is still an active discussion surrounding the two explosion channels (i.e., the thermonuclear and iron core-collapse channels; see Liu et al. 2023 and Janka 2025 for recent reviews), the upper and lower end of the stellar mass range has overall been well explored, and there is at least a superficial consensus on how these stars end their lives. In contrast, the fate of intermediate mass stars (8 − 12 M⊙) remains equivocal and has so far been sparsely explored. A common idea is that these stars end their lives as so-called electron-capture supernovae (ECSNe; Miyaji & Nomoto 1987; Nomoto 1984, 1987), where, initiated by electron capture reactions, the star loses the pressure support provided by degenerate electrons and collapses under its own weight, resulting in an SN explosion and leaving behind an NS. Previous research (Isern et al. 1991; Canal et al. 1992; Jones et al. 2016, 2019a,b; Kirsebom et al. 2019; Leung et al. 2020) has shown that, contrary to the previous notion that ECSNe end in a collapse, a thermonuclear explosion can in theory also be achieved. Although these thermonuclear ECSNe (tECSNe) can help explain some otherwise difficult to produce species in the solar inventory of isotopes – tECSNe show a strong production of 48Ca, 50Ti, and 52Cr as well as several Zn-Zr isotopes (Jones et al. 2019b) – without introducing substantial tensions elsewhere, it is not clear if tECSNe exist in nature or if they are purely a theoretical phenomenon. While synthetic observables of collapsing ECSNe (cECSNe) have been matched to existing observations (e.g., Kozyreva et al. 2021), they differ little from low-mass CCSNe, and the observational properties of tECSNe are so far unknown. Moreover, it is not yet clear what determines either outcome and how the transition from collapse to thermonuclear explosion impacts observational properties such as the ejecta composition. Answering the latter question is the focus of the current work.
In general, ECSNe occur when the ONe core of an intermediate mass star – commonly super asymptotic giant branch (sAGB) stars (see Doherty et al. 2017 for a review) – reaches the Chandrasekhar mass limit (MCh), usually through repeated unstable He shell burning cycles (Ritossa et al. 1999; Jones et al. 2013). This mass limit can also be reached in an ONe WD that stably accretes mass from a binary companion (Schwab et al. 2015), also known as accretion-induced collapse (AIC; see Nomoto & Kondo 1991), or in the case of a close binary system through stable He shell burning after the envelope of the star has been stripped (Podsiadlowski et al. 2004; Tauris et al. 2015). Since the precise progenitor scenario is somewhat ambiguous, we are somewhat agnostic of the precise channel by which MCh is reached.
Regardless of the mass accretion mechanism, once the ONe core reaches a critical central density, the electron capture reaction 20Ne → 20F → 20O will set in1. This reaction has a twofold effect. On the one hand, it causes the pressure support of the core to drop and therefore the core to contract, further increasing its density and the rate at which electron captures occur. This initiates a feedback loop that, if nothing else can counteract it, will cause the core to collapse. On the other hand, this electron capture chain releases energy through γ-decay of 20O (Martínez-Pinedo et al. 2014) and thereby can ignite runaway thermonuclear burning of the ONe plasma in the form of 16O + 16O burning (Isern et al. 1991; Canal et al. 1992; Gutierrez et al. 1996; Schwab et al. 2015, 2017; Zha et al. 2019). Although the resultant increase in temperature will increase the electron capture rate on 20Ne (as well as other isotopes found in the burning products) and thereby accelerate the collapse, thermonuclear burning provides a mechanism to counteract the onset of collapse. In this pivotal moment, the outcome of an ECSN depends on which process can outweigh the other.
Typical cECSNe simulations (e.g., Janka et al. 2008; Wanajo et al. 2011; Zha et al. 2022) predict that eventually the gravitational collapse will overcome the thermonuclear burning, and the resulting cECSNe will lead to the formation of an NS. Jones et al. (2016) found that turbulent burning plays an important role in the evolution of an ECSNe and can potentially be a critical factor in halting the gravitational collapse and subsequently overturning it, leading to a thermonuclear explosion.
From previous studies, both outcomes have been established. However, it is not clear where the transition from one regime to the other occurs. Specifically, it remains uncertain how the central density that the ONe core reaches at the onset of thermonuclear runaway, along with the location of ignition (or more precisely the impact of convection prior to the ignition; see, e.g., Gutierrez et al. 1996), influences the final outcome. Although there exist 1D studies investigating the fundamentals of flame propagation in this regime (e.g., Timmes & Woosley 1992; Schwab et al. 2020), as well as 2D studies of various initial conditions (e.g., Leung et al. 2020; Zha et al. 2022), this issue has not yet been studied in 3D hydrodynamic simulations. This is important because the fate of the star critically depends on the competition between energy release in the thermonuclear burning and collapse, where the former effect is determined by intrinsically 3D fluid dynamical instabilities that interact with the flame.
We conduct a parameter study, investigating how the central density at ignition and the ignition location impact the outcome of ECSNe. With this study, we aim to establish what conditions support a tECSN outcome and when a cECSN occurs and specifically what physical mechanisms determine either outcome. We also investigated the impact of the laminar flame speed parameterization utilized by our simulations on the evolution of the modeled ECSNe. Furthermore, with our study we aim to provide a large model set that can be used in future studies to establish observational properties of tECSNe in order to determine whether these objects exist in nature or if they remain in the realm of theory.
Our work is organized as follows. First, we present the numerical tools used in our parameter study as well as the included physics in Section 2. Second, we provide an overview over the different ECSN modes observed in our models in Section 3. Third, Section 4 provides a detailed investigation into the impact of the laminar flame speed as well as what role turbulence plays in overcoming the collapse. Finally, Section 5 presents the results of our parameter study itself and a discussion about under which conditions our simulations yield a tECSN or cECSN outcome. We end with some concluding remarks and an outlook on future work in Section 6.
2. Methods
2.1. Explosion simulations
Our ECSN simulations were performed using the LEAFS code. This code has been used in a variety of SN Ia-like applications (see, e.g., Röpke & Hillebrandt 2005; Röpke et al. 2007; Seitenzahl et al. 2013; Fink et al. 2014, 2018; Ohlmann et al. 2014; Marquardt et al. 2015; Lach et al. 2022a,b), and, in particular, other ECSN studies (Jones et al. 2016, 2019b; Kirsebom et al. 2019). The LEAFS code has been adapted from the PROMETHEUS code (Fryxell et al. 1989) by Reinecke et al. (1999a) for its use in SN Ia studies. It uses a piecewise parabolic scheme (Colella & Woodward 1984) to solve the reactive Euler equations. The computation takes place on a 3D Cartesian grid that is able to follow both the evolution of the flame front and the expansion of the star by nesting a uniform Cartesian grid inside a nonuniform Cartesian grid (Röpke et al. 2006). Flame fronts were treated using a level-set technique (Osher & Sethian 1988) as described by Reinecke et al. (1999b). Our fiducial set of simulations uses the laminar flame speed prescription of Timmes & Woosley (1992, hereafter TW92); for select models, we also compare simulations using the more recent flame speed parameterization of Schwab et al. (2020, hereafter S20). Both TW92 and S20 obtain their parameterization from a linear fit to simulations of conductive flames under various conditions; the latter, however, includes more modern microphysics and a larger nuclear reaction network. In particular, the formula of S20 considers a varying value of Ye for a fixed fuel composition, whereas the formulation of TW92 assumes Ye = 0.5 and varies the fuel composition.
A subgrid model for turbulence (Schmidt et al. 2006a,b) was used to account for the contribution of unresolved turbulent velocity fluctuation to the effective flame speed. In contrast to the work of Jones et al. (2016, 2019b), we did not use a spherical Newtonian gravitational potential, but rather a fast Fourier transform-based approach, solving the full Poisson equation for Newtonian gravity. During the initial phase of the explosion, we did not expect significant deviations from a spherical potential. However, because pure deflagrations can leave behind bound remnants with substantial kick velocities (e.g., Lach et al. 2022a), thereby deviating from spherical symmetry, we opted for the more flexible approach of solving the full Poisson equation.
The code uses an equation of state (EOS) that comprises a mixture of electrons and positrons modeled as an arbitrarily relativistic Fermi gas, ions modeled as a perfect gas, and thermal radiation, following the implementation described in Timmes & Swesty (2000)2. All of our simulations include Coulomb corrections, following the formulation of Yakovlev & Shalybkov (1989). Here we utilized a Butterworth filter (Butterworth 1930) to allow for a smoother transition between the corrected and non-corrected regimes to avoid numerical issues arising from the sharp transition found in the original implementation3. Nuclear burning inside the flame front is included through tabulated abundances of the burning products (see Fink et al. 2010; Ohlmann et al. 2014; Jones et al. 2016). This approximate nuclear network estimates the energy release from nuclear reactions by following six pseudo-species: 4He, 12C, 16O, 20Ne, 28Si, and 56Ni. This also includes thermal neutrino losses using the formulae of Itoh et al. (1996, see Seitenzahl et al. 2015).
We followed the (de)leptonization of the NSE ashes as described in Jones et al. (2016, Section 2.3). Here, electron captures and in general reactions such as β-decays and e+-captures are accounted for; their impact on Ye is calculated from tabulated Ẏe(ρ,Y,T,Ye) values. This table was computed by Jones et al. (2016) following Seitenzahl et al. (2009) and Pakmor et al. (2012). The relevant rates were taken from Langanke & Martínez-Pinedo (2000), Oda et al. (1994), Fuller et al. (1985), and Nabi & Klapdor-Kleingrothaus (2004), with approximations from Arcones et al. (2010) and Sullivan et al. (2015). This formalism also accounts for the mean energy losses from neutrinos produced in these reactions. We note that we assumed that if Ye ≲ 0.25 is reached in the plasma, the density must be high enough for neutrino interactions to substantially alter Ye. We do not account for neutrino interactions in our work and assumed that our simulations become invalid as Ye → 0.25. Therefore, we limited our Ẏe table to Ye ≥ 0.25.
Lastly, to increase the robustness of the numerical scheme, we extended the original method of Colella & Woodward (1984) by switching to a more dissipative Rusanov flux function (Rusanov 1962; Badwaik et al. 2020) in regions where high-Mach flows develop, such as during the interaction of the SN ejecta with the background pseudo-vacuum. This pseudo-vacuum was set to a fixed density (1 × 10⁻⁵ g cm−3) and energy (1.0 erg) and is therefore not in hydrostatic equilibrium.
2.2. Initial conditions
Our initial ONe WD models4 closely follow the initial conditions of Jones et al. (2016, 2019b): We considered a homogeneous composition of 65% 16O and 35% 20Ne by mass, and parameterize the hydrostatic equilibrium configuration of the resulting MCh WD by its central density ρcini. Furthermore, we imposed that the initial temperature stratification is flat and the temperature is 5 × 10⁵ K. Due to the fully degenerate nature of WD matter, the temperature does not significantly impact the subsequent evolution of the system. Importantly, temperature dependent electron capture reactions are only simulated inside the burning region, where the temperature is determined by the nuclear energy release; outside this region, electron capture reactions are too slow to play a role on the timescales simulated here. To account for the preceding stellar evolution, we used a constant Ye = 0.493 for the entire WD. This value was calculated by Jones et al. (2013) using a mass-weighted average of a 8.75 M⊙ progenitor computed with the stellar evolution code MESA (Paxton et al. 2011, 2013, 2015). For more details and discussion, see Jones et al. (2013, 2016).
In our parameter study, we used several central densities ranging from 9.95 < log10ρcini < 10.4. This range represents the uncertainty in the ignition density corresponding to the ability (or not) of convection or semi-convection to transport heat away from the hot spot efficiently enough to delay the ignition and allow the star to contract further before the explosion (e.g., Gutierrez et al. 1996). This density space is narrowed down for each ignition geometry (see Section 2.3) in a binary search pattern to narrow the density at which the collapse transitions to a thermonuclear explosion; due to the computational cost, a uniform density grid would be infeasible. For a complete list of the central densities of the initial models, see Table A.15.
2.3. Ignition geometries
The ignition process occurs on scales not resolved by our numerical grid, and therefore we had to assume an ignition geometry once the initial flame had grown to a size resolved by our simulation. This gave us some freedom in choosing the initial shape of the flame. The location of the flame can in principle be determined by either 1D stellar evolution simulations or, if the electron captures trigger a convective instability, 3D reactive hydrodynamics simulations. At the time of writing there exist no self-consistent 3D stellar evolution models of such ONe core ignitions that sufficiently constrain the ignition location. Therefore, guided by 1D stellar evolution simulations with state-of-the-art nuclear physics input (Kirsebom et al. 2019), we examined the dependence of the transition density on the ignition location by adopting five different ignition locations: 2.5 km, 10 km, 20 km, 35 km, 50 km, and 73 km offset from the center of the WD. In contrast to previous simulations of thermonuclear explosions in CO WDs (e.g., Seitenzahl et al. 2013) and the tECSN simulations of Jones et al. (2016), we ignited in a single location. Here, we started our parameter grid at 2.5 km instead of 0 km, as the latter would lead to artificially symmetric explosions; 2.5 km, however, means that the center of the WD is still covered by our ignition bubble (see below), but the symmetry is broken by introducing a preferential direction. The upper limit of 73 km was motivated by the work of Kirsebom et al. (2019) and Zha et al. (2019) who suggest that a single hotspot can form up to around this radius. We did not investigate multi-spot ignitions as they are deemed unlikely (Kuhlen et al. 2006; Zingale et al. 2009; Nonaka et al. 2012). For multi-spot ignitions of tECSNe, see Jones et al. (2016).
As an ignition spot, we chose a composite of nine individual overlapping spheres, similar to the ignition spot utilized by Lach et al. (2022a), effectively adding a initial perturbations on scales resolved by the grid that would naturally develop from Rayleigh-Taylor (RT) instabilities. Here, each individual sphere has a radius of 5 km, and the entire structure has a width of 18.5 km. These values were chosen such that each individual sphere is resolved by at least a few cells, whereas the nine spheres are provided to add some initial perturbations on the resolved scales compared to just one single, larger sphere6. We found no indication that this choice has a noticeable impact on the simulation results. In particular, the outcome of our simulations seems robust against the precise shape and size of the ignition bubble.
In each simulation, this composite ignition bubble was placed at the ignition locations listed above. The simulation grid was tuned so that it retains a high resolution in the central region, leading to a resolution of 700 m in the uniform part of the grid (up to a distance of 135 km along each axis); this allowed us to at least roughly resolve the curvature of the ignition spheres. To ensure comparability between simulations, the same initial grid was used throughout the parameter space; for example, for the more central ignitions we could narrow down the central uniform region to achieve higher central resolution, but for the most off-center cases the ignition spot would end up outside this region. During the first timestep, the material inside the ignition bubble is then burned to ashes while maintaining pressure equilibrium, initiating the explosion without introducing spurious shocks. As a consequence, the density inside the ignition spot is artificially reduced. However, the thereby induced buoyant motion does not interfere with the flame front and is, in general negligible compared to the buoyancy naturally developing over time.
We labeled each WD explosion model as rho< central density> _r< ignition radius>, that is, the model with log ρcini = 9.95 (g cm−3) ignited at 73 km would be named rho9.95_r73. In simulations where we used the updated flame speed prescription of S20, we appended the suffix _sfs; otherwise the flame speeds of TW92 are utilized. A complete overview of all 56 simulated models can be found in Table A.1.
3. ECSNe modes
Before investigating the specific conditions under which the thermonuclear explosion can overcome the gravitational collapse, we first provide a general overview of the different modes we observe in our ECSN simulations. Here, we focus on a mostly phenomenological description; we present a more in-depth discussion in the Section 4. Figure 1 illustrates the four different explosion and collapse outcomes. Here, all models start with the same inital flame, but with different values of ρcini.
 |
Fig. 1. Illustration of the different ECSN modes observed in our parameter study. Each row shows a separate simulation, with each column representing various characteristic times. In each plot, the top half indicates Ye and the bottom half ⟨A⟩ (note the varying limits in the color bars). Here, we also show contours of uniform log ρ (g cm−3). We note that in the last timestep of rho10.4_r73, we no longer fully trust the results of the simulation (e.g., the reappearance of heavier elements in the ashes is likely only an artifact) and only include this timestep as a visual indication of how the ashes get compressed into a sphere. |
First, we have the prompt explosion, depicted in the first row of Figure 1, showing the example of the rho9.95_r73 model. In this case, the flame starts to rise buoyantly almost immediately, accelerating, and the flame propagation becomes dominated by its turbulent flame speed (see Jones et al. 2016). The gravitational collapse is quickly stopped and the explosion can unbind enough material to leave behind a stable WD remnant. Importantly, the remnant is composed of O and Ne at its core, with only a subtle contribution from the burnt ashes in a surface layer. This is very similar to typical pure deflagrations in CO WDs with a single spot off-center ignition (see, e.g., Lach et al. 2022a).
Second, at a somewhat higher central density in the rho10.11875_r73 model (second row of Figure 1), we find the marginal explosion mode. In this tECSN mode, the flame just barely manages to halt the gravitational collapse. As we show later in Section 4, small changes to, for example, the laminar flame speeds can overturn this outcome. The distinct difference from the previous prompt explosion mode is that here, the flame (or more precisely the ashes) sinks into the core of the WD, incinerating, and thereby neutronizing the material in the core. This substantially reduces the effective MCh (MCh, eff), further favoring the cECSN outcome. Here, ρcini is still low enough so that thermonuclear burning prevails and a tECSN is the result. What further sets this scenario apart from the previous one (and pure deflagrations with a single-spot off-center ignition in CO WDs in general) is that the burning front incinerates the core, leaving behind a bound ONeFe remnant. In this case, the core of the remnant is to a large fraction composed of burning products, importantly neutron-rich Fe-group elements. This raises the question whether the remnant will be stable or not, since these ashes will result in a Mch, eff value lower than for our initial WD and only very little mass is ejected for some of our models (in extreme cases less than 0.1 M⊙). In this work, we do not follow the detailed evolution of the bound remnant. A more detailed investigation of the fate of the remnant object will be left for future work.
Third, in the rho10.146875_r73 model shown in the third row of Figure 1, by just slightly increasing the density, we find the marginal collapse mode. It is similar to the previous one, with the difference that here the gravitational pull wins and the WD irreversibly collapses. Importantly, however, the collapse does not manage to completely overpower the burning everywhere (see Section 4 for a description of this mechanism), and part of the flame rises outward and begins to incinerate the outer shell. Due to the limitations of our code, we cannot follow the collapse, so it remains to be seen if the simulation leads to the formation of a neutron star and if the burning leads to any significant mass ejection.
Last, in our highest density model rho10.4_r73, shown in the last row of Figure 1, we find the prompt collapse mode. Here, gravity is able to almost immediately overtake the runaway burning. More precisely, the drop in Ye due to electron captures happens so fast that the bubble loses too much pressure support without being able to rebuild it efficiently through nuclear burning. The bubble is then compressed by the surrounding fluid, which has a higher pressure, and its density increases and sinks buoyantly into the WD core. The neutronization of hot material (burning to an extent continues; it is just no longer dynamically relevant) further destabilizes the WD core so fast that collapse is inevitable. What appears to be important here is that the ashes sink into the core much faster than in, for example, the marginal collapse case (see the first column of Figure 1 where different densities at 0.1 s are illustrated), causing this crucial region to neutronize faster. It should be noted that, in all collapsing cases, the thermonuclear burning accelerates the collapse. This is both due to the increase in temperature and density that increases electron capture rates, as well as the ashes enabling electron captures on, for example, free protons, which is significantly more efficient than electron captures on 20Ne. Therefore, while electron captures on 20Ne alone are sufficient for a runaway collapse, thermonuclear burning additionally accelerates the collapse if the ashes sink into the core.
In general, we find these four modes for all ignition locations. However, the r2.5 and r10 series do not exhibit sinking of the ashes toward the core (at least not to the extent that they interact with the flame front) as our ignition hot bubbles already encompass this region due to their size; even in the r20 series, only a marginal amount of sinking ashes can be observed. How the sinking ashes interact with the flame front critically depends on the laminar flame speed. We explore this relationship in the following Section 4.
4. Explosion versus collapse
In this section, we examine the impact of the choice of laminar flame speed parameterization on the outcome of our ECSN simulations and discuss what physical mechanisms determine the collapse or explosion outcome. Specifically, we compare the laminar flame speed parameterizations of TW92, given as
 (1)
(1)
to that of S20, given as
![Mathematical equation: $$ \begin{aligned} v_\mathrm{lam} = 16.0\,\rho _9^{0.813}\left[1+96.8\,(0.5 - Y_e)\right]\,\mathrm{km} \,\mathrm{s} ^{-1}. \end{aligned} $$](/articles/aa/full_html/2026/03/aa57910-25/aa57910-25-eq2.gif) (2)
(2)
We note that the laminar flame speeds of S20 are typically slower than the ones of TW92 for the same fuel composition, see Figure 5 of S20. However, as already stated in Section 2, the parameterization of TW92 does not consider cases where Ye ≠ 0.5, whereas S20 does. As illustrated in Figure 9 of S20, the low Ye value is the main driver of the large difference in laminar flame speeds.
The total flame speed vf is then given by the formula
 (3)
(3)
following Schmidt et al. (2006b), where vturb2 = 2Ksgs/ρ and Ksgs is the subgrid-scale turbulent kinetic energy. For turbulent flame speeds vturb much higher than the laminar flame speed, the total flame speed asymptotically approaches
 (4)
(4)
that is, it becomes dominated by the turbulent flame speed. In contrast vf ≈ vlam if vturb ≪ vlam.
4.1. Neutronization of the core
The laminar flame speeds are important during the initial burning before the flame propagation becomes dominated by the turbulent flame speed, at least in the exploding cases. Although the initial laminar flame growth rate impacts the subsequent nuclear energy release through a larger burning volume at the time when the turbulent propagation becomes dominant, in this section we focus on its impact on the question of whether or not a model collapses or explodes. For 1D flames, this has already been extensively studied by TW92, and we can now verify some of their hypotheses based on our 3D simulations.
In Figure 2, we illustrate the initial stages of the rho10.094140625_r50(_sfs) model for both laminar flame speed prescriptions. Importantly, the model variant using the TW92 flame speeds results in a tECSN, whereas the one using the S20 flame speeds results in a cECSN. It should be mentioned that in the rho10.094140625_r50 model, we also reach the limit of our Ẏe table, and therefore the outcome is not entirely certain; the arguments we present here are based on the phases before we reach this point. In the upper half of Figure 2, at t = 0.1 s, it becomes immediately apparent that the higher laminar flame speed in the S20 case leads, as expected, to the burning of a larger volume. See also the second row of Figure 3, which illustrates the total mass of the burned material over time. This also leads to a greater nuclear energy release, and therefore it is somewhat counterintuitive that this case will collapse because the increase in energy release should provide more stability against collapse. However, the faster flame speed leads to the neutronization of a larger mass; we remind the reader that electron captures in the ashes are much more efficient, both due to the increase in temperature as well as electron captures on nuclei other than 20Ne, for example, free protons. Consequently, MCh, eff drops faster, see the first row of Figure 3, and the WD begins to contract earlier. As can be seen in the lower half of Figure 2, at t = 0.4 s, the rho10.094140625_r50_sfs model exhibits higher radial Mach numbers ℳrise toward the center, i.e., the contraction is much more advanced than in the rho10.094140625_r50 model. This is also evident in the ρmax values shown in Figure 3, where the density of the rho10.094140625_r50_sfs model increases sharply after 0.4 s compared to the rho10.094140625_r50 case. At densities examined in our studies, the free-fall time scale is rather short, with tff ≈ 0.02 s, and therefore, the evolution of the central density is extremely sensitive to changes in the effective MCh.
 |
Fig. 2. Visualization of the impact of different laminar flame speed parameterizations on the example of the rho10.093130625_r50(_sfs) model. The left column shows the simulation with the TW92 flame speeds, the right column the one with the S20 values. The top two rows show the simulation a t = 0.1 s, the bottom two at t = 0.4 s. Here, we show four different quantities: the density and internal energy with respect to their values at the ignition location (at t = 0.0 s), the mach number of the flow in the radial direction ℳrise, and the electron fraction Ye. Note the different ranges of the ℳrise color bars. |
 |
Fig. 3. Various quantities related to the neutronization of the core in the comparison between the TW92 and S20 laminar flame speed parameterizations. First row: Effective MCh, computed using the mass weighted value of Ye over the entire WD. The horizontal dashed line indicates the mass of the initial WD. Second row: Total mass of the ash Mash, i.e., mass inside the level set. Third row: Maximum density ρmax over time. Last row: Maximum total flame speed vf, max of the flame anywhere on its surface. Here we also show the values of both the turbulent and laminar flame speed contribution. The vertical dotted lines indicate the time of the first simulation snapshot that where MCh, eff is well below the initial WD mass. |
This contraction leads nuclear burning becoming less efficient. What happens is that the energy release from burning to NSE increases with density, up to a certain threshold. Beyond this threshold, the energy release decreases again due to, for example, photodisintegration. Further contributing to this destabilizing effect is the circumstance that neutronization of the material in the ashes substantially reduces the internal energy; see the upper half of the first row in Figure 2, removing a stabilizing contribution.
This is in large parts due to energy loss from weak neutrinos generated from electron capture reactions, which at the present densities escape freely without interacting with the material7. Critically, as illustrated in Figure 4, in both the TW92 and S20 cases the energy loss through weak neutrinos (i.e., from electron capture reactions) is greater than the energy generated from nuclear burning, with the exception of the initial phase, where the material is not yet rapidly neutronizing over a large volume. This means that the net energy generation is negative, contributing to the overall contraction of the WD. In this figure, it can also be seen that the rho10.094140625_r50_sfs model exhibits a negative gradient in nuclear energy generation, whereas in the rho10.094140625_r50 case the release of nuclear energy substantially increases, eventually leading to a net positive energy release. At this point, the WD starts to expand again, leading to a slower neutronization and a decrease in energy loss through neutrinos. In this context, we briefly mention thermal neutrinos as well. As illustrated in Figure 4, their contribution to the overall energy balance is negligible; the largest contribution to the thermal neutrino energy loss comes from plasmon-neutrinos and photo-neutrinos. It should be noted that this balance is specific to these initial conditions. In cases where the neutronization is much less prevalent (e.g., the rho10.0625_r73(_sfs) models), this balance reverses and the nuclear energy generation always outweighs the energy loss from weak neutrinos; in these cases a tECSNe is the clear result anyway.
 |
Fig. 4. Total (cumulative) energy generated from nuclear reactions over time as well as energy lost from weak and thermal neutrinos. |
As collapse (or at least contraction) has already set in, the energy release needs to increase to rebuild the pressure support against gravitational collapse. Therefore, once the core has contracted beyond this threshold, the burning rate needs to increase to prevent collapse. Although the rate at which material is burned increases in the rho10.094140625_r50_sfs model, see the slope of Mash in Figure 3, it is not enough to rebuild the pressure support and overcome the energy loss from neutrinos and the core collapses.
However, looking at the values of MCh, eff, Mash, and ρmax in Figure 3, both models eventually reach a point where the core becomes unstable and begins to contract; on the surface the difference in laminar flame speed seems to only lead to a relative time difference in contraction occurring. Similarly, neither model achieves net positive energy generation when considering the energy lost through, for example, weak neutrinos. Moreover, considering the maximum total flame speed vf, max, the rho10.094140625_r50_sfs seems to exhibit overall faster flame speeds for most of its evolution (which can also be seen at the larger physical extent of the burned region in Figure 2). Consequently, the question arises why the rho10.094140625_r50_sfs model collapses, whereas the rho10.094140625_r50 model does not. The key here is the development of turbulence and its contribution to the maximum flame propagation speed, as we show in the next section.
4.2. Development of turbulence
An important mechanism in tECSNe is, as investigated by Jones et al. (2016), the development of turbulence and its impact on the flame propagation. In this section, we investigate the role of turbulence in preventing gravitational collapse. For a 1D deflagration in ONe WDs (as well as for CO WDs), this has been extensively studied by TW92, estimating criteria for explosion vs. collapse. We now reexamine their results for our 3D simulations; importantly, our simulations do not assume a central ignition.
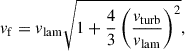
For completeness, we briefly summarize the relations already derived by TW92. The material passed by the burning front in scenarios such as ours heats up substantially, causing a decrease in density. The resultant density gradient, in combination with the gravitational acceleration, causes the formation of a RT instability. Here, TW92 define the period8 or growth rate as
 (5)
(5)
with λ = 2π/k being the wavelength of the instability and Δρ = ρ2 − ρ1,  being the density differential and average across the flame front. From this quantity, it can be deduced that for any small-scale deformation to form (for a given laminar flame speed), it needs to be larger than a certain minimal scale λmin, which can be written as
 (6)
(6)
Here, the laminar flame speed vlam is equivalent to the conductive flame speed vcond in the nomenclature of TW92.
Next, TW92 assume isobaric conditions for the NSE material. Although we find small-scale deviations from isobaric conditions, we still find it a good enough approximation for the following arguments. The electron density inside the bubble drops as a result of electron captures, and consequently the pressure drops as dictated by the EOS. The pressure contrast with the surrounding regions compresses the bubble, thus increasing its gas density and pressure until pressure equilibrium is finally restored (see, e.g., Cox et al. 2006). Because the electron-capture reaction time scale inside the bubble is ≈100 times longer than the sound-crossing time over the size of the bubble, compression occurs subsonically and one can accurately assume that electron captures occur under isobaric conditions. Therefore, we can define a so-called recovery time trecov after which the density has recovered to the value it had before the flame passed the material.
TW92 illustrate this for various initial densities in their Figure 8. We also find this density inversion and recovery time in our simulations. In both timesteps shown in Figure 2 it can clearly be seen that the density immediately behind the flame initially drops but begins to increase to its original value after a while, even increasing beyond this value. We note that this density increase is the reason for the sinking ashes we observe in many of our simulations. Initially, when at a lower density, the ashes begin to buoyantly rise (see the ℳrise values in Figure 2), but electron captures are so fast that the density rapidly increases before the ashes can rise to regions of sufficiently lower densities. Consequently, the ashes begin to sink to the center of the WD (see the ℳrise values in Figure 2). In this context, we point out the relevance of the laminar flame speed. In the TW92 case, the ashes sink with a velocity comparable to vlam. This causes the fluid motion to interact with the flame front, causing its perturbation. In contrast, the S20 vlam is much larger (as discussed in the introductory paragraph of Section 4 this is due to the S20 parameterization considering the impact of decreasing Ye), and therefore, the ashes do not interact with the flame front (at least not to the same degree). This is evident in Figure 2, where the much smoother flame front can be seen in the S20 case (in the center). Furthermore, the RT instabilities in the ashes are much less pronounced than in the TW92 case.
Returning to the recovery time trecov described by TW92, we briefly analyze the value found for our rho10.094140625_r50(_sfs) models. For this, we follow the density evolution of the tracer particles that are inside the initial ignition bubble at t = 0.0 s. The result is illustrated in Figure 5. Here, we show both the individual tracer trajectories and the average evolution. The horizontal line indicates the initial density at the ignition location. From this, trecov is immediately apparent. As expected, the resultant trecov ≈ 0.05 s is independent of the choice of vlam as it is connected to the electron capture process; the slight differences between the two flame speed prescriptions in Figure 5 is due to the stochasticity of the tracer particles. It is rather reassuring that we obtain a value quite similar to TW92, who find trecov ≈ 0.03 s. Given the different setups (density and composition) as well as the included physics, a small difference is expected.
 |
Fig. 5. Illustration of the density inversion of the rho10.094140625_r50 model for the TW92 and S20 flame speed parametrization. Here, we show the density trajectories of tracer particles that are located inside the ignition bubble at t = 0.0 s. The transparent lines are the individual trajectories, whereas the opaque lines are the mean density of all trajectories. |
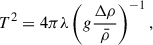
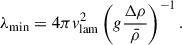
From the existence of this recovery time, TW92 infer a finite thickness of the density inversion region and from this an upper limit on the length scale of deformations:
 (7)
(7)
As a consequence, once λmin > λmax, no deformations can form and the flame will propagate in a stable manner. TW92 suspect this crossover as the deciding factor between explosion and collapse, that is, if λmax > λmin the outcome is a thermonuclear explosion and vice versa, see their Figure 9b. While their analysis exclusively focuses on the conductive propagation of the flame, our simulations also consider the contribution of turbulence to the propagation speed of the flame, and therefore we have the opportunity to revisit their results in a more complete setup. Looking at their Figure 9b, we find that at ρcini = 12.4 × 10⁹ g cm3 of our rho10.094140625_r50 model they predict a thermonuclear explosion by a small margin. Note that their case A, which we compare here has a lower 16O mass fraction than our model, but for this qualitative argument we deem this a close enough match. Their prediction is confirmed by our simulation, and our rho10.094140625_r50 model results in a thermonuclear explosion using the prescription of TW92.
In contrast, our simulations predict a collapse for the same model when using the S20 parameterization. This is particularly surprising because, as discussed in the previous Section 4.1, a faster flame speed should lead to a larger nuclear energy release, thereby providing more energy to counteract the collapse. Or, looking at this the other way around, both models generate less nuclear energy than is lost through neutrinos during the contraction phase, and therefore one could expect that both models collapse. Additionally, the simulation using the TW92 parameterization shows the same contraction after accounting for the relative time difference in the neutronization of the core due to the slower flame speed. Therefore, the question arises as to why one model collapses, whereas the other does not.
The answer lies in the development of turbulence and its impact on the flame propagation. While in the model using the TW92 parameterization the flame propagation becomes dominated by its turbulent contribution rather quickly (see Figure 3), the faster vlam of S20 suppresses the formation of instabilities. Essentially, because λmax ∝ vlam but λmin ∝ vlam2, the minimum unstable length scale will grow faster with vlam than the maximum deformation length scale λmax and the flame will remain stable.
The turbulent propagation of the flame is important as it can thereby reach much higher speeds than its laminar counterpart9. This is critical as this allows the flame to burn much farther outward before the core region becomes unstable due to its neutronization. Since the flame thereby reaches regions of lower density, it is less susceptible to the decrease in efficiency described in Section 4.1. The flame can thus effectively rebuild the pressure support needed to prevent collapse and lead to an explosion, as is evident in the decreasing ρmax in Figure 3. Figure 6 illustrates this mechanism, where we show both models at the point in time where their MCh, eff drops below the initial WD mass. Here, it can be seen that in the rho10.094140625_r50_sfs case, although in the rising part of the flame vturb becomes comparable to vlam, the flame is still mostly propagating with its laminar speed. Importantly, burning occurs at comparably high densities where it is susceptible to becoming less efficient. In contrast, the rising part of the flame in the rho10.094140625_r50 model is almost completely dominated by vturb and burns at significantly lower densities. It should be noted that at the respective simulation time, both models have reached a similar central density due to the initial phase of contraction. However, the flame in the rho10.094140625_r50 case has burned much farther outward (see the scale indicators in Figure 6), where it is able to halt the collapse.
 |
Fig. 6. Illustration of the ratio between vlam and vturb. We show the TW92 (left) and S20 (right) variants of the rho10.094140625_r50 model at the point in time where their MCh, eff drops below the initial WD mass. The gray contour indicates the levelset, whereas the white and black contours indicate surfaces of equal log ρ. We note that although we show vlam/vturb on the whole grid, it is only relevant at the flame surface; we only show it everywhere else for illustration purposes. |
In conclusion, the formation of turbulence does not prevent the collapse by itself. Instead, it allows the flame to propagate fast enough to reach regions of lower density where burning is efficient enough to prevent the collapse. At these lower densities electron captures are also slower, thereby reducing the energy loss through neutrinos; see the reduction in energy loss in Figure 4. Although we content ourselves with only a qualitative analysis here, it is nevertheless satisfying to see that the hypothesis of TW92 appears to be confirmed by modern 3D simulations.
We note that in our simulations, flame propagation starts fully laminar as turbulence has yet to develop. However, the flame could already be dominated by turbulence by the time it reaches scales resolved by our numerical grid. Here, the arguments made above apply as well and it depends on factors such as vlam, trecov, and the density profile if turbulence is suppressed or if instabilities can form. Therefore, this is less of a concern for our higher density models, for example, the rho10.094140625_r50_sfs model discussed above, where instabilities are suppressed. In contrast, models such as the rho9.95_r73 may already be fully dominated by the turbulent flame propagation by the time the flame reaches scales resolved by our computational grid, and one has to distinguish between model and reality.
5. Parameter study
We now focus on the results of our parameter study, that is, for which ρcini and rign combinations our simulations predict a thermonuclear explosion or a collapse. Before discussing our results, we briefly remind the reader of what we interpret as a thermonuclear explosion versus a collapse outcome. Since our LEAFS code cannot follow the full collapse to, for example, an NS, rather only the onset of collapse, and our code is limited to Ye ≥ 0.25, we can only give an initial prediction if a simulation actually collapses. These predictions will require confirmation in full core-collapse simulations. Therefore, we defined a simulation to predict a cECSNe if we observe a large volume reaching Ye = 0.25 for an extended period of time and a rapid increase of ρmax by several orders of magnitude. Jones et al. (2016) stopped following simulations once they reach Ye = 0.25, but for their simulations this was only a necessary condition for a collapse; they also identified the collapse based on a rapid density increase10. For the density extremes (low and high) in our study, the outcome is usually clearly identifiable. However, once we approach the transition regime, it is less clear how to interpret our simulations, in particular, when simulations start to reach the edges of our Ẏe table. As long as only a few cells reach this limit, it will most likely not affect the outcome, and we tolerate Ye = 0.25 in our explosion vs. collapse decision. Since we do not observe cases where Ye = 0.25 is reached in a large volume for an extended period of time and simultaneously see a tECSNe outcome, we deem this acceptable. In short, we only classify simulations as cECSN if we observe a rapid increase in density of several orders of magnitude.
Figures 7 and A.1 illustrate the resultant Yemin and ρmax trajectories of all our simulations, both for simulations using the TW92 and S20 flame speed prescriptions. Here, we mark the models that we interpret as cECSNe with “x” at the end of their trajectories. From this, it can be seen that collapsing models experience a sharp density increase, whereas exploding models show, if at all, only a modest increase in ρmax before the explosion unbinds substantial amounts of material. As explained in Section 4, this increase in density comes from an initial phase of contraction until burning can become efficient enough to outweigh, for example, the energy loss from neutrinos. From these figures, it can also be seen that for some of the more marginal cases, such as rho10.05195312_r20 or rho10.11875_r73 the WD initially, over ≈1.0 s, the model contracts with ρmax gradually increasing. In these cases, Yemin decreases to Ye = 0.25 before contraction stops. However, this is only in a small region in the central part of the WD, where the ashes have sunk into the core. In the outer region, the flame is growing steadily until it can eventually unbind enough material to sufficiently reduce the pressure of the core; at this point ρmax decreases again.
 |
Fig. 7. Simulation history of all simulations in our parameter study. The left column shows the minimal electron fraction Yemin, and the right column shows the maximum density ρmax. Both quantities are the extrema found anywhere in the simulation. These trajectories are used to estimate if a simulation results in an explosion or a collapse. (Continued in Figure A.1.) |
The limitations of our Ẏe table can also be seen, for example in the rho10.4_r73 model. Here Yemin = 0.25 is reached within ≈0.05 s. Looking at the corresponding ρmax trajectory in Figure A.1, one can observe a kink and the density increase somewhat slows down. This is, of course, unphysical. The density increase caused by a reduction in Ye no longer contributes, and therefore ρmax increases more slowly. However, in these simulations the outcome is not affected by this effect. By the time Yemin = 0.25 is reached, the WD core is already starting to collapse and the burning effectively only contributes by its neutronizing effect rather than its nuclear energy release (see Section 4.1), and we can confidently predict that these models will end up as a cECSN.
Looking closer at some of the Yemin trajectories, for example, of rho10.08359375_r50 in the second row of Figure A.1, we can see two characteristic features. The first is the rapid drop in Yemin for t > 0.8 s. In the beginning Yemin drops comparably slow, but after this point the neutronization seems to increase rapidly. This is because for t < 0.8 s, the electron captures occur approximately at a constant density. However, as the ashes sink into the core, they destabilize the WD and it begins to contract. This causes the electron capture rates in the core to increase (see also the ρmax trajectory). In these models, the outward burning flame manages to trigger an explosion just in time before the WD can collapse. The second feature is that after the explosion is able to unbind the material and the density decreases, the ashes releptonize until the NSE composition freezes out; the Yemin trajectory forms a plateau after this point.
We note that, as already discussed by Jones et al. (2019b), our Yemin evolution is notably different from previous work on ECSNe. Specifically, comparing our work to Miyaji & Nomoto (1987), who find a Yemin ≈ 0.34 at the onset of collapse, whereas we find Yemin = 0.25. There is some ambiguity as to how the quantities were computed in both works, but the trend is clear. As illustrated in Jones et al. (2019b, Figure 4), the inclusion of the electron capture rates by Nabi & Klapdor-Kleingrothaus (2004) leads to a much more rapid drop in Ye for Ye ≲ 0.45 compared to the case without these rates. Interestingly, if one assumes the Ye evolution without the rates by Nabi & Klapdor-Kleingrothaus (2004) several of our cECSN models would likely end up as a tECSN instead. Comparing our Yemin and ρmax trajectories to those found by Leung et al. (2020, Figure 3), we find good qualitative agreement, at least in cases where our simulations agree on the outcome. Specifically our exploding models achieve a similar Yemin as their exploding models for the same ρcini. This is insofar not surprising as both their and our simulation heavily rely on the electron capture rates of Nabi & Klapdor-Kleingrothaus (2004) for this regime.
In summary of our results, we illustrate the outcome for each simulation we performed in Figure 8. The first thing that stands out is that the an off-center ignition generally allows a higher ρcini, while still resulting in a tECSN. We emphasize that the same trend is visible for the density at the ignition location, i.e., the transition from explosion to collapse does not seem to occur simply at a fixed ignition density. As described in Section 4, the sinking ashes that destabilize the core play a critical role in accelerating the collapse. Consequently, the time it takes for the ashes to sink (or rise to lower density regions), or in other words, the distance of the ignition from the center, affects the outcome, leading to the trend seen in Figure 8. Somewhat related to this is the noticeable jump between the r10 and r20 series. To an extent, this is over-exaggerated by the uneven resolution of our model grid, but there is also a physical argument to be made. In the r2.5 and r10 series, the ignition spot covers the WD center at t = 0.0 s (the width of the ignition bubble is 18.5 km), and the flame immediately starts neutronizing the core. Importantly, the sinking ashes do not significantly interact with the flame front.
 |
Fig. 8. Outcomes of all simulations in our parameter study dependent on ignition location and central density at ignition. Here the dashed and dotted lines indicate the transition from explosion to collapse for the TW92 and S20 flame speeds, respectively. These lines are only serve as a guide for the eye as they only show the midpoint between the last exploding and first collapsing simulation. We note that this figure does not include simulations with log ρcini = 10.4 for better visibility. |
In contrast, the r20 ignition spot initially does not cover the center. Therefore, some time passes before the ashes start to sink into the core (in addition to the time it takes for the density to increase again). This gives the flame some more time to grow and potentially result in a tECSN at slightly higher ρcini. It remains to be seen how sensitive this is to smaller (or larger) ignition bubbles, but an argument is to be made that for smaller ignition bubbles the laminar flame speed is fast enough to grow the burned area to our nominal ignition bubble size before neutronization can noticeably impact Mch, eff.
This picture does not change substantially for models that use S20 flame speeds. As detailed in Section 4, the faster flame speed also leads to an accelerated decrease in Mch, eff and a more efficient suppression of turbulence. Therefore, a tECSN seems to only be possible for a comparably lower ρcini. However, a thermonuclear explosion is possible for all rignition, irrespective of the flame speed parametrization, as long as ρcini is low enough. Overall, our results agree well with the outcomes predicted by Jones et al. (2016, 2019b), even though we use a single-spot ignition instead of a multi-spot ignition (as well as several more technical changes, such as the change to the EOS and the gravity solver, see Section 2). Moreover, our results are in line with the trend already suggested by Leung et al. (2020) (see their Table 2), i.e., that a more off-center ignition supports the tECSN outcome for higher ρcini. However, their numerical methods, for example the employed subgrid scale model for turbulence, differ from those implemented in LEAFS. Additionally, their simulations are limited to lower resolution in 2D and only cover one quadrant. Therefore, it is difficult to interpret their somewhat lower transition density for a given ignition geometry.
Our parameter study does not consider the impact of varying initial composition and instead keeps the composition of our initial WD fixed at 65%/35% ONe. This values is strongly linked to the evolutionary path required to reach the density regime considered here (Jones et al. 2013). For example, the presence of residual C can cause an ignition at lower densities during electron capture on 24Mg and 25Mg (Antoniadis et al. 2020). This is particularly interesting as the 12C(α, γ)16O reaction rate is especially uncertain (e.g., An et al. 2015; Pepper et al. 2022), and therefore it is not clear which conditions will actually be reached at O ignition. However, we estimate our results to be robust against smaller changes to this initial composition, at least relative to the difference in transition densities caused by the choice of laminar flame speed parameterization. Changes to the O to Ne ratio will, on the one hand, as shown by S20, change the laminar flame speed only by a small amount, particularly compared to the difference caused by varying Ye. On the other hand, a change in initial composition will impact the resulting energy release from nuclear burning, equally affecting the ECSN outcome. In general, it is not clear in which direction the transition density will shift with an increase in, for example, the Ne fraction. An increase in the Ne fraction will decrease the nuclear energy release from burning (favoring the cECSN outcome), but simultaneously also decrease the laminar flame speed, thereby reducing the suppression of turbulence (favoring the tECSN outcome). This also extends to effects such as Ne depletion in the core, that is a non-uniform initial composition, or the contamination by, for example, residual Mg (which can also be non-uniformly distributed). The likely most relevant effect of the initial composition will be the Ye reached at ignition, given its notable impact on the laminar flame speed (at least in the S20 formulation), with higher Ye values favoring the tECSN outcome. A nonuniform Ye composition will be particularly interesting as the suppression of turbulence will be highly localized due to the strong Ye dependence of the S20 laminar flame speed. Further numerical simulations are required to establish to what extent the transition density depends on the initial composition.
6. Conclusions
In this work, we presented a parameter study of 3D hydrodynamic simulations of ECSNe starting at the time of thermonuclear ignition. With this study, we investigated under which conditions a deflagration in a high-density ONe core leads to a cECSN or a tECSN, and what physical mechanisms are relevant in determining the outcome. In total, we conducted 56 full 3D hydrodynamic simulations using the LEAFS code.
Here, in Section 3, we found four distinct modes in which ECSNe can proceed: the prompt and marginal explosion and collapse cases. Each of these modes is interesting in its own right, but the marginal cases are of particular interest in the present work. Not only are these models indicative of the transition from explosion to collapse, but these marginal cases also exhibit (in the case of an off-center ignition) a sinking of the ashes toward the WD core; an effect not seen in deflagrations in CO WDs or lower-density ONe WDs, where the ashes purely rise buoyantly (see, e.g., Seitenzahl et al. 2013; Fink et al. 2014; Lach et al. 2022a). Although the physical effect causing this sinking – the density inversion due to rapid electron captures (Timmes & Woosley 1992) – has long been known, only now in full 3D simulations can we observe its impact on the outcome of pure deflagrations. In particular, the most direct effect of this process is that it accelerates the destabilization of the WD by poisoning its core with neutron-rich material. Moreover, this means that much of the neutron-rich ashes become trapped in the core. The resulting bound remnant in the case of a thermonuclear explosion consequentially contains an extremely metal-rich core, and it is not clear if the bound remnant will remain stable for longer periods of time. An investigation of the bound remnants will be the focus of future research. Furthermore, it remains to be seen if, in the collapsing cases, the asymmetries introduced by thermonuclear burning and the sinking of the ashes have a significant impact on the subsequent core-collapse. This is of particular interest for the marginal collapse case, where additionally the rising part of the thermonuclear flame could potentially unbind substantial amounts of material, thereby favoring the formation of extremely low-mass NSs.
In Section 4, we also investigated the impact of various parameterizations of the laminar flame speed and how the development of turbulence affects the outcome of an ECSN. Here, we found that, counterintuitively, a higher laminar flame speed favors the collapse outcome. In general, a faster laminar flame speed leads to higher nuclear energy release. However, the neutronization of the ashes that sink into the center leads to a contraction of the WD, further raising its density. Additionally, during this initial phase, nuclear burning is not able to outweigh the energy loss from escaping weak neutrinos, contributing to the contraction. The contraction and the subsequent increase in density cause nuclear burning to become less efficient (at least for the density ranges found in marginal and collapsing cases). This process occurs to some extent regardless of the choice of laminar flame speed, but it may be less important in lower density scenarios where electron captures are comparably slow. However, in the case of the slower flame speeds of TW92, instabilities can form and flame propagation becomes dominated by the substantially faster turbulent flame speed. As a consequence, this model can reach regions with lower densities where nuclear burning is efficient again, ultimately making it more likely to produce a tECSN. In the case of the S20 flame speeds, turbulence is suppressed and the flame remains laminar and remains confined to high density regions. Eventually, the burning is overpowered, and the result is a cECSN. This comparison illustrates the importance of the conductive flame speed in these marginal cases, as it largely determines the outcome. In the prompt explosion mode (and for similar reasons the prompt collapse), the conductive flame speed is not as relevant as the flame will be rapidly dominated by its turbulent flame speed (see Jones et al. 2016) which will then determine most of the subsequent dynamics.
The main result of our parameter study is described in Section 5 and illustrated in Figure 8 showing that, depending on the ignition location, a wide range of ρcini supports a tECSN. Therefore, it is important for stellar evolution models to accurately determine both the location (or locations) at which the thermonuclear burning starts and the central density that the ONe core has reached at this point to determine whether or not the resulting event is a tECSNe or cECSNe. Although, at the point of writing, recent studies have suggested a range of ignition conditions are possible (see, e.g., Kirsebom et al. 2019), an accurate determination of the ignition process will require multidimensional simulations to fully capture the impact of convection and other inherently multidimensional effects (see, e.g., Denissenkov et al. 2013; Jones et al. 2016). Moreover, as investigated by Kirsebom et al. (2019), the ignition process itself is sensitive to specific decay rates (they find that an increased electron capture rate on 20Ne leads to an ignition at lower central densities, thereby favoring the tECSN outcome) during the evolution leading up to the runaway. Therefore, it remains an open question what conditions in terms of ρcini can be reached before the ignition from a stellar evolution perspective.
In summary, we find that tECSNe from high-density ONe WDs are predicted from our simulations, but the outcome strongly depends on the conditions at ignition. Factors such as laminar flame speed, neutronization rate, nuclear energy release, and turbulence formation play an important role in determining the outcome, particularly in the transition region from explosion to collapse. Deflagrations in high-density ONe WDs can cause part of the ashes to sink into the WD core, a mechanism not observed in low-density deflagrations, for example, in CO WDs. This mechanism can potentially have a significant impact on the evolution of the bound remnant object and may alter the ejecta composition by trapping the most neutron rich species in the remnant object. Additionally, the asymmetric explosion can impart a large kick velocity to the bound remnant object. Therefore, it remains to be seen whether tECNSe can potentially explain objects such as hyper-velocity LP40-365 stars (e.g., Vennes et al. 2017; Raddi et al. 2019; El-Badry et al. 2023), which have been hypothesized to be the remnants of deflagrations in ONe WDs. More work is needed to determine the long-term fate of these iron-rich bound remnants, as well as the structure and composition of the ejecta and will be the focus of future research.
Acknowledgments
A.H. and C.F. are fellows of the International Max Planck Research School for Astronomy and Cosmic Physics at the University of Heidelberg (IMPRS-HD) and acknowledges financial support from IMPRS-HD. This work received support from the European Research Council (ERC) under the European Union’s Horizon 2020 research and innovation programme under grant agreement No. 759253 and 945806, the Klaus Tschira Foundation, and the High Performance and Cloud Computing Group at the Zentrum für Datenverarbeitung of the University of Tübingen, the state of Baden-Württemberg through bwHPC and the German Research Foundation (DFG) through grant no INST 37/935-1 FUGG. The authors gratefully acknowledge the Gauss Centre for Supercomputing e.V. (www.gauss-centre.eu) for funding this project by providing computing time through the John von Neumann Institute for Computing (NIC) on the GCS Supercomputer JUWELS at Jülich Supercomputing Centre (JSC). The authors acknowledge support by the state of Baden-Württemberg through bwHPC and the German Research Foundation (DFG) through grant INST 35/1597-1 FUGG. This work was supported by the Deutsche Forschungsgemeinschaft (DFG, German Research Foundation) – RO 3676/7-1, project number 537700965, and by the European Union (ERC, ExCEED, project number 101096243). Views and opinions expressed are, however, those of the authors only and do not necessarily reflect those of the European Union or the European Research Council Executive Agency. Neither the European Union nor the granting authority can be held responsible for them. This work was performed on the HoreKa supercomputer funded by the Ministry of Science, Research and the Arts Baden-Württemberg and by the Federal Ministry of Education and Research. This work was supported by the U.S. Department of Energy through the Los Alamos National Laboratory. Los Alamos National Laboratory is operated by Triad National Security, LLC, for the National Nuclear Security Administration of U.S. Department of Energy (Contract No. 89233218CNA000001).
References
- An, Z.-D., Chen, Z.-P., Ma, Y.-G., et al. 2015, Phys. Rev. C, 92, 045802 [Google Scholar]
- Antoniadis, J., Chanlaridis, S., Gräfener, G., & Langer, N. 2020, A&A, 635, A72 [NASA ADS] [CrossRef] [EDP Sciences] [Google Scholar]
- Arcones, A., Martínez-Pinedo, G., Roberts, L. F., & Woosley, S. E. 2010, A&A, 522, A25 [NASA ADS] [CrossRef] [EDP Sciences] [Google Scholar]
- Badwaik, J., Chandrashekar, P., & Klingenberg, C. 2020, Commun. Appl. Math. Comput., 2, 541 [Google Scholar]
- Boccioli, L., & Roberti, L. 2024, Universe, 10, 148 [NASA ADS] [CrossRef] [Google Scholar]
- Butterworth, S. 1930, Exp. Wireless & Wireless Eng., 7, 536 [Google Scholar]
- Canal, R., Isern, J., & Labay, J. 1992, ApJ, 398, L49 [NASA ADS] [CrossRef] [Google Scholar]
- Chanlaridis, S., Antoniadis, J., Aguilera-Dena, D. R., et al. 2022, A&A, 668, A106 [NASA ADS] [CrossRef] [EDP Sciences] [Google Scholar]
- Colella, P., & Woodward, P. R. 1984, J. Comput. Phys., 54, 174 [NASA ADS] [CrossRef] [Google Scholar]
- Cox, J. P., Weiss, A., Weiss, A., & Giuli, R. T. 2006, in Cox and Giuli’s Principles of Stellar Structure, Extended 2nd edn., repr edn. (Cambridge: Cambridge Scientific Publishers), Adv. Astron. Astrophys., 8 [Google Scholar]
- Denissenkov, P. A., Herwig, F., Truran, J. W., & Paxton, B. 2013, ApJ, 772, 37 [NASA ADS] [CrossRef] [Google Scholar]
- Doherty, C. L., Gil-Pons, P., Siess, L., & Lattanzio, J. C. 2017, PASA, 34, e056 [NASA ADS] [CrossRef] [Google Scholar]
- El-Badry, K., Shen, K. J., Chandra, V., et al. 2023, Open J. Astrophys., 6, 28 [CrossRef] [Google Scholar]
- Fink, M., Röpke, F. K., Hillebrandt, W., et al. 2010, A&A, 514, A53 [NASA ADS] [CrossRef] [EDP Sciences] [Google Scholar]
- Fink, M., Kromer, M., Seitenzahl, I. R., et al. 2014, MNRAS, 438, 1762 [NASA ADS] [CrossRef] [Google Scholar]
- Fink, M., Kromer, M., Hillebrandt, W., et al. 2018, A&A, 618, A124 [NASA ADS] [CrossRef] [EDP Sciences] [Google Scholar]
- Fryxell, B., Müller, E., & Arnett, D. 1989, Hydrodynamics and Nuclear Burning (Max-Planck-Inst. für Physik und Astrophysik) [Google Scholar]
- Fuller, G. M., Fowler, W. A., & Newman, M. J. 1985, ApJ, 293, 1 [NASA ADS] [CrossRef] [Google Scholar]
- Gutierrez, J., Garcia-Berro, E., Iben, I., Jr., et al. 1996, ApJ, 459, 701 [NASA ADS] [CrossRef] [Google Scholar]
- Iben, I., Jr., & Tutukov, A. V. 1984, ApJS, 54, 335 [NASA ADS] [CrossRef] [Google Scholar]
- Isern, J., Canal, R., & Labay, J. 1991, ApJ, 372, L83 [NASA ADS] [CrossRef] [Google Scholar]
- Itoh, N., Hayashi, H., Nishikawa, A., & Kohyama, Y. 1996, ApJS, 102, 411 [NASA ADS] [CrossRef] [Google Scholar]
- Janka, H.-T. 2025, Long-Term Multidimensional Models of Core-Collapse Supernovae: Progress and Challenges [Google Scholar]
- Janka, H. T., Müller, B., Kitaura, F. S., & Buras, R. 2008, A&A, 485, 199 [NASA ADS] [CrossRef] [EDP Sciences] [Google Scholar]
- Jones, S., Hirschi, R., Nomoto, K., et al. 2013, ApJ, 772, 150 [NASA ADS] [CrossRef] [Google Scholar]
- Jones, S., Röpke, F. K., Pakmor, R., et al. 2016, A&A, 593, A72 [NASA ADS] [CrossRef] [EDP Sciences] [Google Scholar]
- Jones, S., Côté, B., Röpke, F. K., & Wanajo, S. 2019a, ApJ, 882, 170 [NASA ADS] [CrossRef] [Google Scholar]
- Jones, S., Röpke, F. K., Fryer, C., et al. 2019b, A&A, 622, A74 [NASA ADS] [CrossRef] [EDP Sciences] [Google Scholar]
- Kirsebom, O. S., Jones, S., Strömberg, D. F., et al. 2019, Phys. Rev. Lett., 123, 262701 [NASA ADS] [CrossRef] [Google Scholar]
- Kozyreva, A., Baklanov, P., Jones, S., Stockinger, G., & Janka, H.-T. 2021, MNRAS, 503, 797 [NASA ADS] [CrossRef] [Google Scholar]
- Kuhlen, M., Woosley, S. E., & Glatzmaier, G. A. 2006, ApJ, 640, 407 [NASA ADS] [CrossRef] [Google Scholar]
- Lach, F., Callan, F. P., Bubeck, D., et al. 2022a, A&A, 658, A179 [NASA ADS] [CrossRef] [EDP Sciences] [Google Scholar]
- Lach, F., Callan, F. P., Sim, S. A., & Röpke, F. K. 2022b, A&A, 659, A27 [NASA ADS] [CrossRef] [EDP Sciences] [Google Scholar]
- Langanke, K., & Martínez-Pinedo, G. 2000, Nucl. Phys. A, 673, 481 [NASA ADS] [CrossRef] [Google Scholar]
- Leung, S.-C., Nomoto, K., & Suzuki, T. 2020, ApJ, 889, 34 [NASA ADS] [CrossRef] [Google Scholar]
- Liu, Z.-W., Röpke, F. K., & Han, Z. 2023, Res. Astron. Astrophys., 23, 082001 [CrossRef] [Google Scholar]
- Marquardt, K. S., Sim, S. A., Ruiter, A. J., et al. 2015, A&A, 580, A118 [NASA ADS] [CrossRef] [EDP Sciences] [Google Scholar]
- Martínez-Pinedo, G., Lam, Y. H., Langanke, K., Zegers, R. G. T., & Sullivan, C. 2014, Phys. Rev. C, 89, 045806 [CrossRef] [Google Scholar]
- Miyaji, S., & Nomoto, K. 1987, ApJ, 318, 307 [Google Scholar]
- Nabi, J.-U., & Klapdor-Kleingrothaus, H. V. 2004, At. Data Nucl. Data Tables, 88, 237 [Google Scholar]
- Nomoto, K. 1984, ApJ, 277, 791 [NASA ADS] [CrossRef] [Google Scholar]
- Nomoto, K. 1987, ApJ, 322, 206 [NASA ADS] [CrossRef] [Google Scholar]
- Nomoto, K., & Kondo, Y. 1991, ApJ, 367, L19 [NASA ADS] [CrossRef] [Google Scholar]
- Nonaka, A., Aspden, A. J., Zingale, M., et al. 2012, ApJ, 745, 73 [NASA ADS] [CrossRef] [Google Scholar]
- Oda, T., Hino, M., Muto, K., Takahara, M., & Sato, K. 1994, At. Data Nucl. Data Tables, 56, 231 [NASA ADS] [CrossRef] [Google Scholar]
- Ohlmann, S. T., Kromer, M., Fink, M., et al. 2014, A&A, 572, A57 [NASA ADS] [CrossRef] [EDP Sciences] [Google Scholar]
- Osher, S., & Sethian, J. A. 1988, J. Comput. Phys., 79, 12 [NASA ADS] [CrossRef] [Google Scholar]
- Pakmor, R., Edelmann, P., Röpke, F. K., & Hillebrandt, W. 2012, MNRAS, 424, 2222 [Google Scholar]
- Paxton, B., Bildsten, L., Dotter, A., et al. 2011, ApJS, 192, 3 [Google Scholar]
- Paxton, B., Cantiello, M., Arras, P., et al. 2013, ApJS, 208, 4 [Google Scholar]
- Paxton, B., Marchant, P., Schwab, J., et al. 2015, ApJS, 220, 15 [Google Scholar]
- Pepper, B. T., Istrate, A. G., Romero, A. D., & Kepler, S. O. 2022, MNRAS, 513, 1499 [NASA ADS] [CrossRef] [Google Scholar]
- Podsiadlowski, P., Langer, N., Poelarends, A. J. T., et al. 2004, ApJ, 612, 1044 [NASA ADS] [CrossRef] [Google Scholar]
- Potekhin, A. Y., & Chabrier, G. 2000, Phys. Rev. E, 62, 8554 [NASA ADS] [CrossRef] [Google Scholar]
- Raddi, R., Hollands, M. A., Koester, D., et al. 2019, MNRAS, 489, 1489 [Google Scholar]
- Reinecke, M., Hillebrandt, W., & Niemeyer, J. C. 1999a, A&A, 347, 739 [NASA ADS] [Google Scholar]
- Reinecke, M., Hillebrandt, W., Niemeyer, J. C., Klein, R., & Gröbl, A. 1999b, A&A, 347, 724 [NASA ADS] [Google Scholar]
- Ritossa, C., García-Berro, E., & Iben, I., Jr. 1999, ApJ, 515, 381 [NASA ADS] [CrossRef] [Google Scholar]
- Röpke, F. K., & Hillebrandt, W. 2005, A&A, 431, 635 [NASA ADS] [CrossRef] [EDP Sciences] [Google Scholar]
- Röpke, F. K., Hillebrandt, W., Niemeyer, J. C., & Woosley, S. E. 2006, A&A, 448, 1 [NASA ADS] [CrossRef] [EDP Sciences] [Google Scholar]
- Röpke, F. K., Hillebrandt, W., Schmidt, W., et al. 2007, ApJ, 668, 1132 [NASA ADS] [CrossRef] [Google Scholar]
- Rusanov, V. V. 1962, USSR Comput. Math. Math. Phys., 1, 304 [CrossRef] [Google Scholar]
- Schmidt, W., Niemeyer, J. C., & Hillebrandt, W. 2006a, A&A, 450, 265 [NASA ADS] [CrossRef] [EDP Sciences] [Google Scholar]
- Schmidt, W., Niemeyer, J. C., Hillebrandt, W., & Röpke, F. K. 2006b, A&A, 450, 283 [NASA ADS] [CrossRef] [EDP Sciences] [Google Scholar]
- Schwab, J., & Rocha, K. A. 2019, ApJ, 872, 131 [NASA ADS] [CrossRef] [Google Scholar]
- Schwab, J., Quataert, E., & Bildsten, L. 2015, MNRAS, 453, 1910 [Google Scholar]
- Schwab, J., Bildsten, L., & Quataert, E. 2017, MNRAS, 472, 3390 [NASA ADS] [CrossRef] [Google Scholar]
- Schwab, J., Farmer, R., & Timmes, F. X. 2020, ApJ, 891, 5 [NASA ADS] [CrossRef] [Google Scholar]
- Seitenzahl, I. R., Townsley, D. M., Peng, F., & Truran, J. W. 2009, At. Data Nucl. Data Tables, 95, 96 [NASA ADS] [CrossRef] [Google Scholar]
- Seitenzahl, I. R., Ciaraldi-Schoolmann, F., Röpke, F. K., et al. 2013, MNRAS, 429, 1156 [NASA ADS] [CrossRef] [Google Scholar]
- Seitenzahl, I. R., Herzog, M., Ruiter, A. J., et al. 2015, Phys. Rev. D, 92, 124013 [Google Scholar]
- Sullivan, C., O’Connor, E., Zegers, R. G. T., Grubb, T., & Austin, S. M. 2015, ApJ, 816, 44 [Google Scholar]
- Suzuki, H. 2024, Prog. Theor. Exp. Phys., 2024, 05B101 [Google Scholar]
- Takahashi, K., Sumiyoshi, K., Yamada, S., Umeda, H., & Yoshida, T. 2019, ApJ, 871, 153 [Google Scholar]
- Tauris, T. M., Langer, N., & Podsiadlowski, P. 2015, MNRAS, 451, 2123 [NASA ADS] [CrossRef] [Google Scholar]
- Timmes, F. X., & Arnett, D. 1999, ApJS, 125, 277 [Google Scholar]
- Timmes, F. X., & Swesty, F. D. 2000, ApJS, 126, 501 [NASA ADS] [CrossRef] [Google Scholar]
- Timmes, F. X., & Woosley, S. E. 1992, ApJ, 396, 649 [NASA ADS] [CrossRef] [Google Scholar]
- Vennes, S., Nemeth, P., Kawka, A., et al. 2017, Science, 357, 680 [Google Scholar]
- Wanajo, S., Janka, H.-T., & Müller, B. 2011, ApJ, 726, L15 [NASA ADS] [CrossRef] [Google Scholar]
- Whelan, J., & Iben, I., Jr. 1973, ApJ, 186, 1007 [Google Scholar]
- Yakovlev, D. G., & Shalybkov, D. A. 1989, Astrophys. Space Phys. Rev., 7, 311 [Google Scholar]
- Zha, S., Leung, S.-C., Suzuki, T., & Nomoto, K. 2019, ApJ, 886, 22 [NASA ADS] [CrossRef] [Google Scholar]
- Zha, S., O’Connor, E. P., Couch, S. M., Leung, S.-C., & Nomoto, K. 2022, MNRAS, 513, 1317 [Google Scholar]
- Zingale, M., Almgren, A. S., Bell, J. B., Nonaka, A., & Woosley, S. E. 2009, ApJ, 704, 196 [NASA ADS] [CrossRef] [Google Scholar]
We note that depending on the precise stellar evolution, other electron capture reactions may occur before this point that can trigger thermonuclear burning; for example, electron captures on 24Mg can ignite residual C (see, e.g., Jones et al. 2013; Schwab & Rocha 2019; Antoniadis et al. 2020; Chanlaridis et al. 2022).
The ECSN simulations of Jones et al. (2016, 2019b) used the Timmes EOS (Timmes & Arnett 1999) and Coulomb corrections as formulated by Potekhin & Chabrier (2000) instead.
Our simulations neglect the impact of a potential stellar envelope. Given the spatial extent of such an envelope (see Jones et al. 2013), it will have little effect on the explosion mechanism, and therefore we only focus on the explosion of the bare core (or a WD).
We note that the simulations were not run in sequence, and therefore some parameter combinations could be skipped, hence, the asymmetric parameter spacing.
We note that compared to Lach et al. (2022a), our ignition spot has an additional ninth sphere in the center.
Neutrino-matter interaction starts to become relevant at ρ ≥ 1011 g cm−3 (see, e.g., Boccioli & Roberti 2024; Suzuki 2024). Some of our cECSN simulations nominally reach this value, and it remains to be seen if neutrino-matter interaction plays an important role in the subsequent evolution. Takahashi et al. (2019), for example, argue that interactions with neutrinos can significantly contribute to the flame propagation speed in this regime.
See TW92 for a discussion on defining a period for a nonperiodic motion such as an RT instability.
Figure 3 suggests that the rho10.094140625_r50_sfs model has a much larger total flame speed than the rho10.094140625_r50 model for t ≲ 0.7 s. However, the values shown here originate from the dense and neutron rich core region, not the rising part of the flame. In those regions, the difference between the two models (vlam in particular) is much smaller.
On a more qualitative level, it is usually quite apparent when a simulation will collapse by looking at a visualization, where the collapse can be clearly seen.
Appendix A: Additional figures and tables
This section contains supplementary figures and tables containing various properties of all simulated models. Figure A.1 shows a continuation of Figure 7 for larger ignition radii. Table A.1 lists all the simulated models, as well as their predicted outcome, that is, explosion or collapse.
List of simulated models and their initial properties as well as the simulation outcome for both choices of laminar flame speed parameterization.
All Tables
List of simulated models and their initial properties as well as the simulation outcome for both choices of laminar flame speed parameterization.
All Figures
|
Fig. 1. Illustration of the different ECSN modes observed in our parameter study. Each row shows a separate simulation, with each column representing various characteristic times. In each plot, the top half indicates Ye and the bottom half ⟨A⟩ (note the varying limits in the color bars). Here, we also show contours of uniform log ρ (g cm−3). We note that in the last timestep of rho10.4_r73, we no longer fully trust the results of the simulation (e.g., the reappearance of heavier elements in the ashes is likely only an artifact) and only include this timestep as a visual indication of how the ashes get compressed into a sphere. |
| In the text | |
|
Fig. 2. Visualization of the impact of different laminar flame speed parameterizations on the example of the rho10.093130625_r50(_sfs) model. The left column shows the simulation with the TW92 flame speeds, the right column the one with the S20 values. The top two rows show the simulation a t = 0.1 s, the bottom two at t = 0.4 s. Here, we show four different quantities: the density and internal energy with respect to their values at the ignition location (at t = 0.0 s), the mach number of the flow in the radial direction ℳrise, and the electron fraction Ye. Note the different ranges of the ℳrise color bars. |
| In the text | |
|
Fig. 3. Various quantities related to the neutronization of the core in the comparison between the TW92 and S20 laminar flame speed parameterizations. First row: Effective MCh, computed using the mass weighted value of Ye over the entire WD. The horizontal dashed line indicates the mass of the initial WD. Second row: Total mass of the ash Mash, i.e., mass inside the level set. Third row: Maximum density ρmax over time. Last row: Maximum total flame speed vf, max of the flame anywhere on its surface. Here we also show the values of both the turbulent and laminar flame speed contribution. The vertical dotted lines indicate the time of the first simulation snapshot that where MCh, eff is well below the initial WD mass. |
| In the text | |
|
Fig. 4. Total (cumulative) energy generated from nuclear reactions over time as well as energy lost from weak and thermal neutrinos. |
| In the text | |
|
Fig. 5. Illustration of the density inversion of the rho10.094140625_r50 model for the TW92 and S20 flame speed parametrization. Here, we show the density trajectories of tracer particles that are located inside the ignition bubble at t = 0.0 s. The transparent lines are the individual trajectories, whereas the opaque lines are the mean density of all trajectories. |
| In the text | |
|
Fig. 6. Illustration of the ratio between vlam and vturb. We show the TW92 (left) and S20 (right) variants of the rho10.094140625_r50 model at the point in time where their MCh, eff drops below the initial WD mass. The gray contour indicates the levelset, whereas the white and black contours indicate surfaces of equal log ρ. We note that although we show vlam/vturb on the whole grid, it is only relevant at the flame surface; we only show it everywhere else for illustration purposes. |
| In the text | |
|
Fig. 7. Simulation history of all simulations in our parameter study. The left column shows the minimal electron fraction Yemin, and the right column shows the maximum density ρmax. Both quantities are the extrema found anywhere in the simulation. These trajectories are used to estimate if a simulation results in an explosion or a collapse. (Continued in Figure A.1.) |
| In the text | |
|
Fig. 8. Outcomes of all simulations in our parameter study dependent on ignition location and central density at ignition. Here the dashed and dotted lines indicate the transition from explosion to collapse for the TW92 and S20 flame speeds, respectively. These lines are only serve as a guide for the eye as they only show the midpoint between the last exploding and first collapsing simulation. We note that this figure does not include simulations with log ρcini = 10.4 for better visibility. |
| In the text | |
 |
Fig. A.1. Continuation of Figure 7. |
| In the text | |
Current usage metrics show cumulative count of Article Views (full-text article views including HTML views, PDF and ePub downloads, according to the available data) and Abstracts Views on Vision4Press platform.
Data correspond to usage on the plateform after 2015. The current usage metrics is available 48-96 hours after online publication and is updated daily on week days.
Initial download of the metrics may take a while.