Open Access
Fig. 1.
Download original image
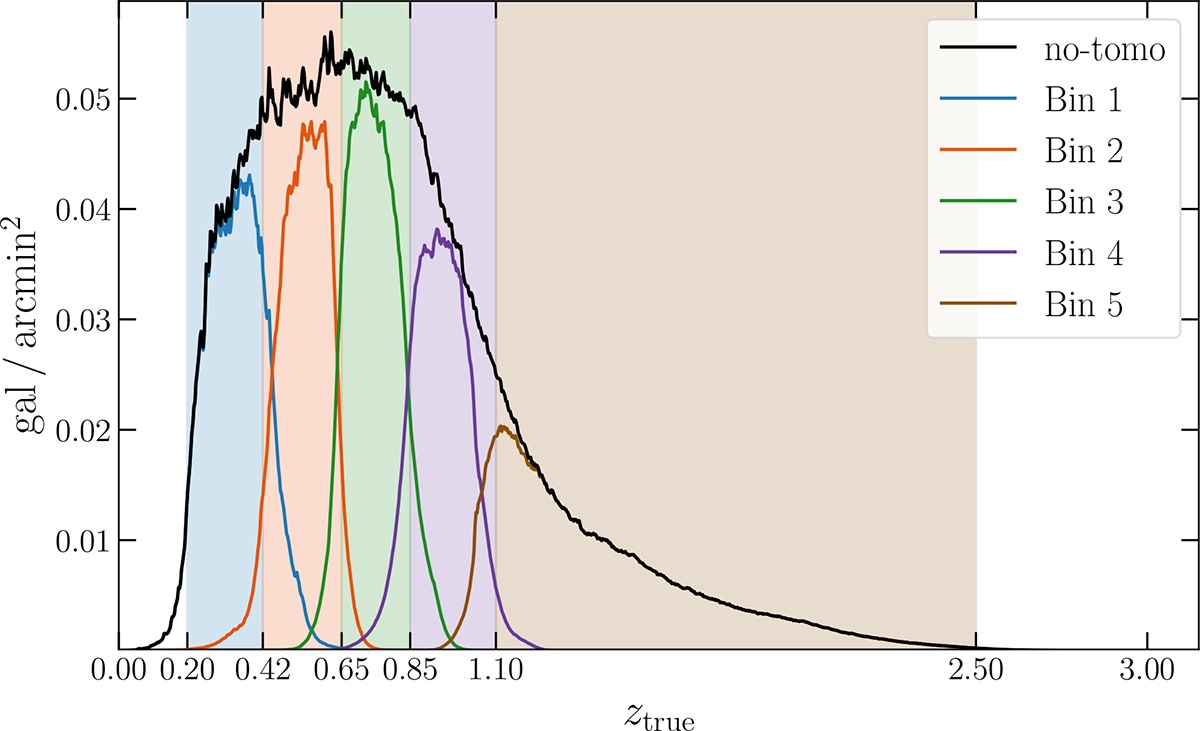
Mean DR1-opt galaxy density distribution as function of true-redshift shown in units of galaxy density for the non-tomographic and five tomographic bins. Shaded areas represent the photometric-redshift edges used to build the five equi-populated slices.
Current usage metrics show cumulative count of Article Views (full-text article views including HTML views, PDF and ePub downloads, according to the available data) and Abstracts Views on Vision4Press platform.
Data correspond to usage on the plateform after 2015. The current usage metrics is available 48-96 hours after online publication and is updated daily on week days.
Initial download of the metrics may take a while.