Fig. 5
Download original image
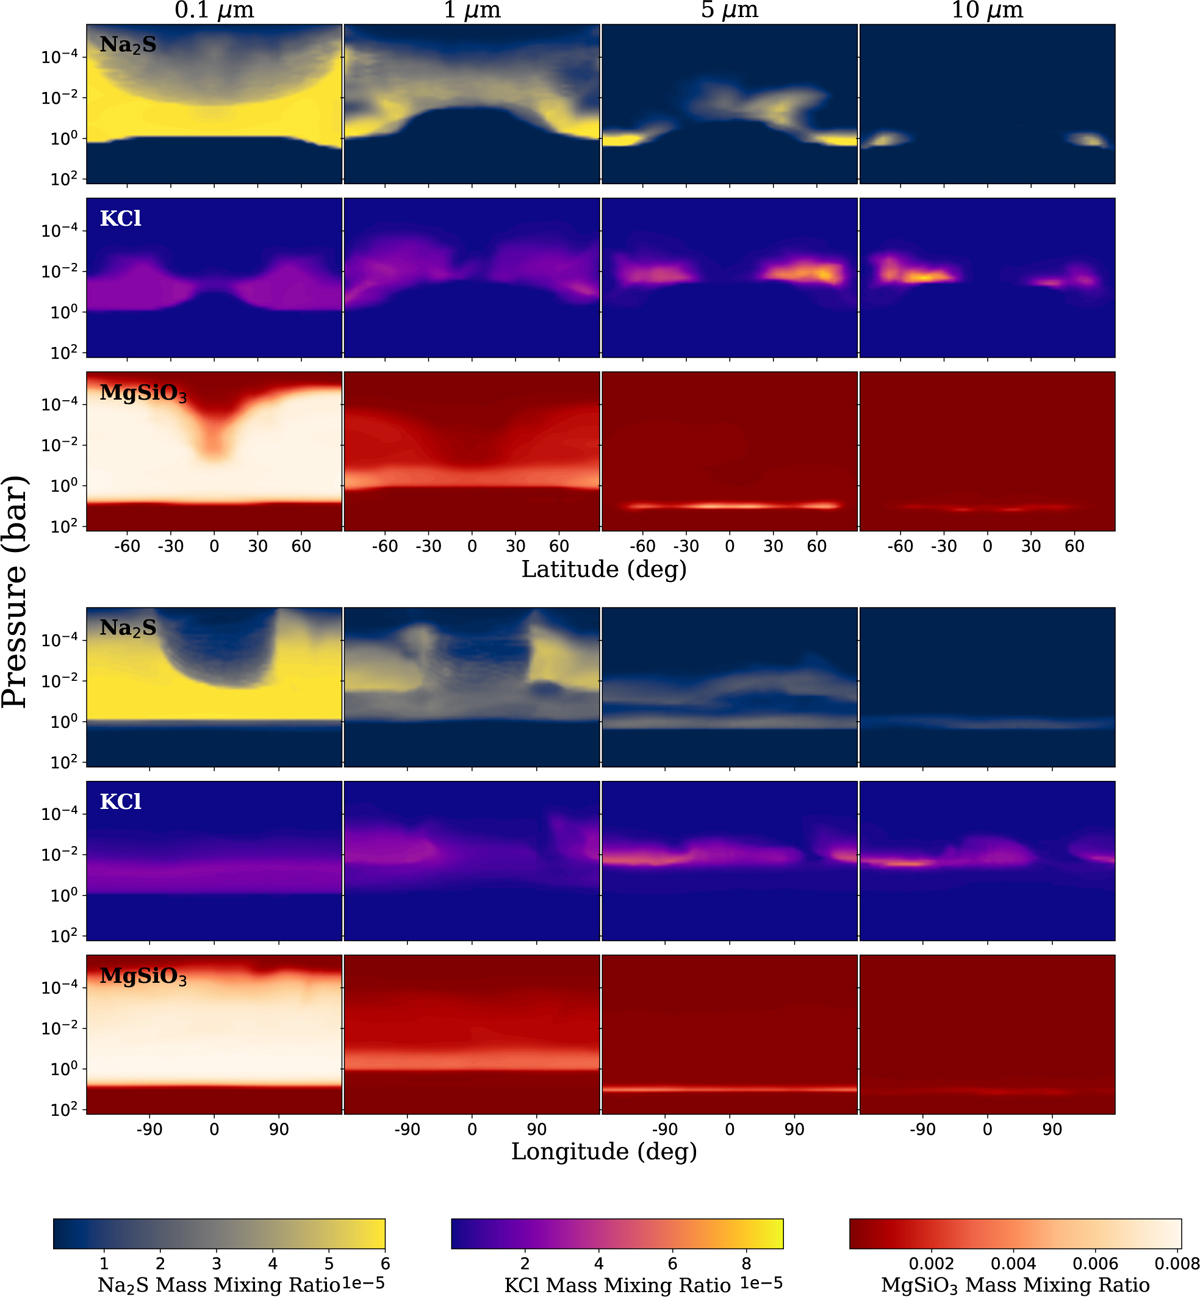
Top: latitudinal distribution of clouds (shows equatorial and polar regions), averaged over longitudes for all models. Within each subplot, the x-axis shows the latitude and the y-axis the pressure. Rows 1, 2, and 3 correspond to Na2S, KCl, and MgSiO3 (with high Tint) clouds, respectively, with each column representing a different particle size indicated at the top. Bottom: same as top, but for longitudinal distribution of clouds (shows dayside and nightside of the planet), averaged over latitudes for all models.
Current usage metrics show cumulative count of Article Views (full-text article views including HTML views, PDF and ePub downloads, according to the available data) and Abstracts Views on Vision4Press platform.
Data correspond to usage on the plateform after 2015. The current usage metrics is available 48-96 hours after online publication and is updated daily on week days.
Initial download of the metrics may take a while.