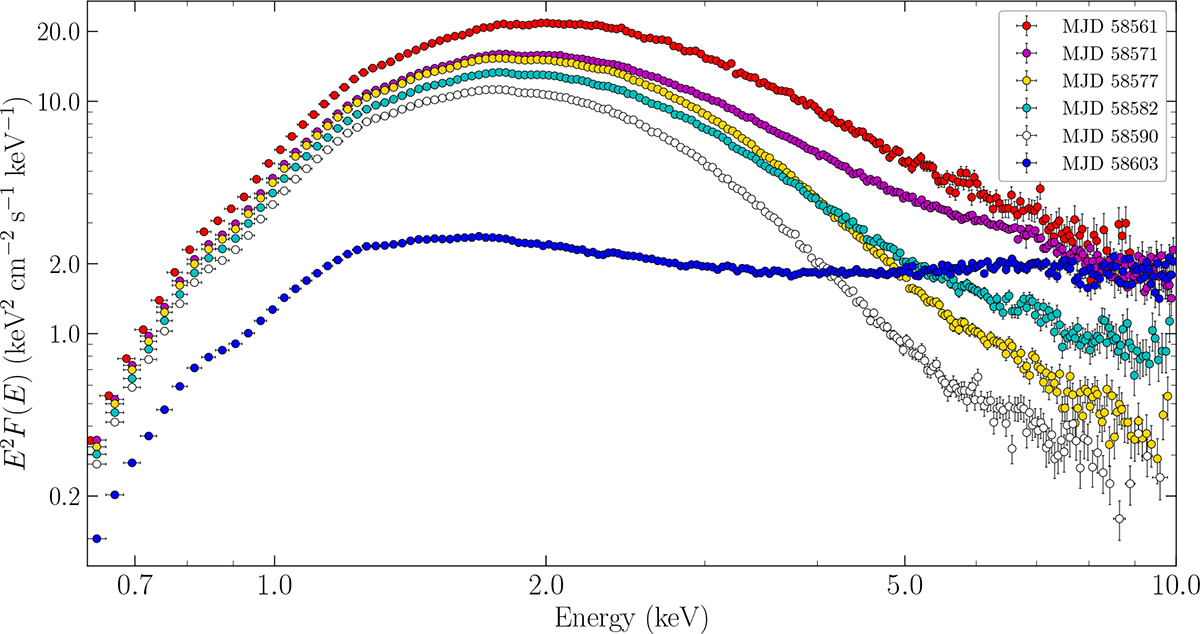
Fig. 3.
Download original image
NICER 0.6–10 keV unfolded energy spectra associated with the PSDs shown in Fig. 2, with the same color code. The unfolded spectra, dominated by the disk component, have been deconvolved against a power law with Γ = 2, without any fitting, and are shown for illustrative purposes. We note that the spectra with broadband noise (magenta and cyan points) have slightly harder tails at high energies than spectra without variability (e.g., yellow and white points), supporting the scenario in which the variability is connected to the hot corona, which may disappear in the aftermath of a discrete ejection.
Current usage metrics show cumulative count of Article Views (full-text article views including HTML views, PDF and ePub downloads, according to the available data) and Abstracts Views on Vision4Press platform.
Data correspond to usage on the plateform after 2015. The current usage metrics is available 48-96 hours after online publication and is updated daily on week days.
Initial download of the metrics may take a while.