Fig. 1.
Download original image
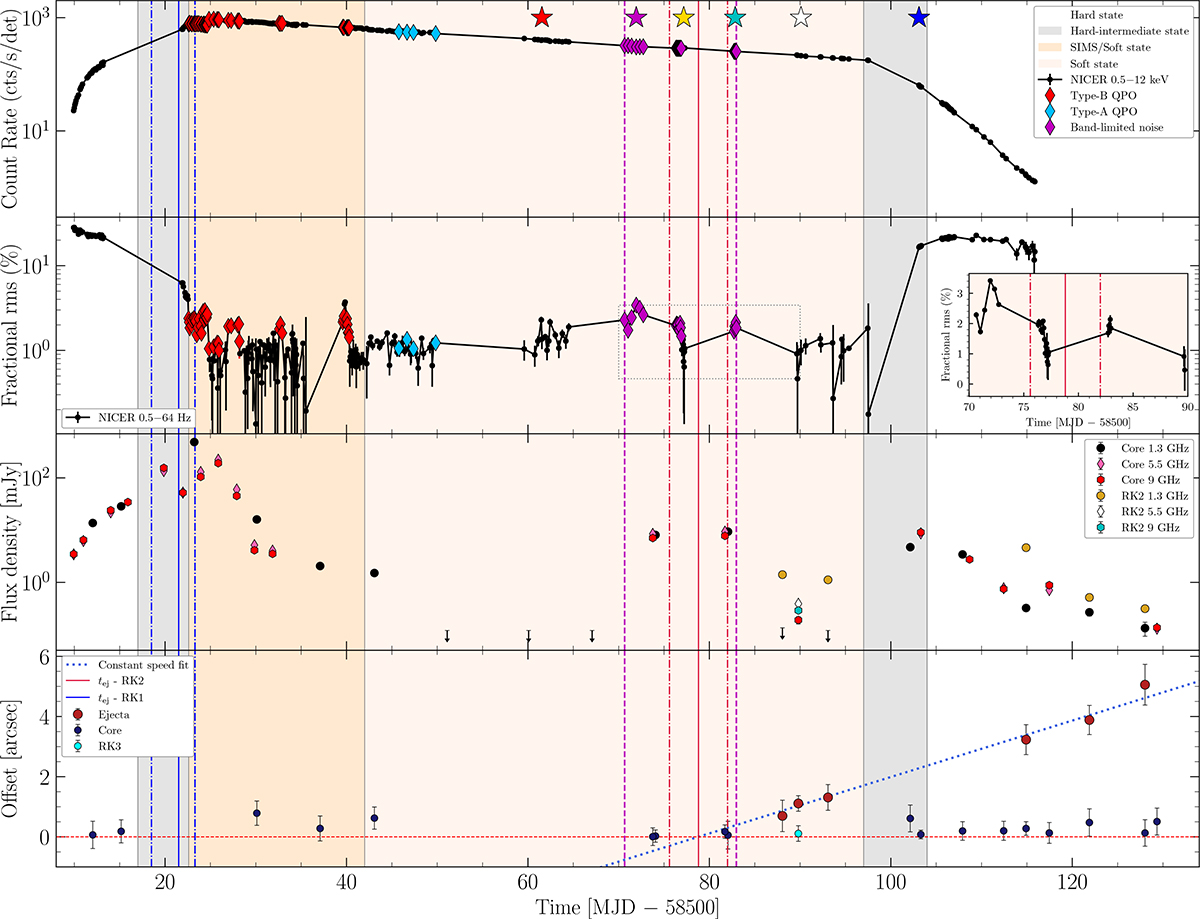
Top panel: NICER 0.5–12 keV X-ray light curve (count rate) of MAXI J1348–630 during its 2019–2020 outburst. The white, light gray, light orange, and light pink regions denote, respectively, the hard, HIMS, SIMS, and SS, from Zhang et al. (2020). The region of vertical dashed purple lines marks the presence of intermittent strong band-limited noise during the SS. Type-B and A QPOs are marked with red and light blue points, respectively. The colored stars mark the times in the light curve at which the power spectra shown in Fig. 2 were obtained. Second panel: X-ray fractional rms variability, calculated in the 0.5–64 Hz frequency range. The inset on the right shows in detail the evolution of the variability between MJD 58570 and 58590. Third panel: MeerKAT (1.3 GHz) and ATCA (5.5 and 9 GHz) core and RK2 radio light curves, from Carotenuto et al. (2021). Bottom panel: Angular separation in arcsec between RK2 and MAXI J1348–630 from the same radio observations. Detections of the core are shown as dark blue points. The single detection of RK3 is also marked with a cyan point. A linear motion was used to fit the RK2 data. The vertical red line marks the RK2 inferred ejection date: tej = MJD 58578.8 ± 3.2, where the two dashed red lines represent the upper and lower bounds of the tej confidence interval. The same is shown in blue for RK1, with ![]() from Carotenuto et al. (2022).
from Carotenuto et al. (2022).
Current usage metrics show cumulative count of Article Views (full-text article views including HTML views, PDF and ePub downloads, according to the available data) and Abstracts Views on Vision4Press platform.
Data correspond to usage on the plateform after 2015. The current usage metrics is available 48-96 hours after online publication and is updated daily on week days.
Initial download of the metrics may take a while.