| Issue |
A&A
Volume 707, March 2026
|
|
|---|---|---|
| Article Number | A175 | |
| Number of page(s) | 12 | |
| Section | Astrophysical processes | |
| DOI | https://doi.org/10.1051/0004-6361/202553849 | |
| Published online | 03 March 2026 | |
Tracing the magnetic field and magnetohydrodynamic turbulence mode in the Cygnus Loop
1
Institute fur Physik und Astronomie Universitat Potsdam Golm Haus 28 D-14476 Potsdam, Germany
2
National Centre for Radio Astrophysics, Tata Institute of Fundamental Research, Pune University Pune 411007, India
3
Deutsches Elektronen-Synchrotron DESY Platanenallee 6 15738 Zeuthen, Germany
★ Corresponding author: This email address is being protected from spambots. You need JavaScript enabled to view it.
Received:
22
January
2025
Accepted:
11
January
2026
Abstract
Magnetic fields pervade the interstellar medium and extend to various scales, including sub-parsec to kiloparsec scales within objects such as supernova remnants (SNRs) and pulsar-wind nebulae. These environments serve as crucial laboratories for understanding cosmic-ray acceleration and scattering processes, which remain poorly understood. The turbulent characteristics of magnetic fields in these regions significantly contribute to observed GeV-TeV emission. The Cygnus Loop (G74.0-8.5) region exemplifies such an environment, hosting a prominent SNR or possibly a combination of two SNRs, and displaying extensive non-thermal emission. In this study, we investigated the mean field inclination angle and dominant magnetohydrodynamic turbulence modes in the Cygnus Loop region, dividing it into southern, central, and northern sub-regions. Employing structure-function, relative anisotropy-based Y-parameter, and modified synchrotron-polarisation analysis using radio polarisation observations, we find that the southern and central regions exhibit low-inclination angles with dominant compressible modes, while the northern region shows ambiguous results with a higher inclination angle. The coherence length estimation suggests values of ∼2.0 pc in all sub-regions. Our study supports a two-SNR morphology for the Cygnus Loop, emphasising the critical role of magnetic fields and turbulence in understanding physical processes in supernova remnants and cosmic-ray transport.
Key words: magnetohydrodynamics (MHD) / polarization / turbulence / ISM: magnetic fields / ISM: supernova remnants / ISM: individual objects: Cygnus Loop
© The Authors 2026
 Open Access article, published by EDP Sciences, under the terms of the Creative Commons Attribution License (https://creativecommons.org/licenses/by/4.0), which permits unrestricted use, distribution, and reproduction in any medium, provided the original work is properly cited.
This article is published in open access under the Subscribe to Open model. This email address is being protected from spambots. You need JavaScript enabled to view it. to support open access publication.
1. Introduction
The interstellar medium (ISM) is permeated by a magnetic field (see a recent review from Yuen et al. 2024), which is a crucial ingredient of all extended objects such as molecular clouds, star-forming regions, and supernova remnants (SNRs; Sun et al. 2006; Reynolds et al. 2012). This magnetic field exhibits a complex structure with strengths spanning from μG to mG, composed of a significant coherent mean field and smaller turbulent and tangled components. The turbulence within this magnetic field significantly impacts diverse physical processes, including particle transport and acceleration (Schlickeiser 2002; Yan & Lazarian 2002; Yan et al. 2012; Beresnyak & Lazarian 2015; Yan 2022; Lemoine 2022).
The SNR shell and the evolution of its surrounding ISM are driven by a combination of factors including thermal particle pressures, turbulence, magnetic fields, and cosmic rays (CRs), all carrying comparable energy budgets within our galaxy (McKee & Ostriker 1977; Boulares & Cox 1990; Ferrière 2001). Moreover, CR pressure influences the behaviour of thermal gas and can contribute to galactic winds e.g., (Girichidis et al. 2018; Hopkins et al. 2018; Holguin et al. 2019). A recent study by Shimoda & Inutsuka (2022) suggests that the observed ISM conditions within our galaxy are sufficient to drive a persistent galactic wind, with a mass-loss rate from the galactic disc comparable to the star formation rate.
Despite extensive research on processes such as CR production in SNRs (Liu et al. 2019), CR transport in the ISM (Yan & Lazarian 2002), and CR-ISM interactions (Habegger et al. 2024), many aspects of these phenomena remain unresolved. Therefore, investigating particle acceleration to high energies within extended objects such as SNRs, where diffusive acceleration from shock waves and magnetohydrodynamic (MHD) turbulence govern the CR acceleration and scattering, provides a conducive environment for investigating these phenomena. The Cygnus Loop (G74.0-8.5) region exemplifies such an environment, hosting a prominent SNR or possibly a combination of two SNRs, exhibiting extensive non-thermal emission. The unique characteristics of this location allow for detailed studies using multi-wavelength infrared, optical and UV observations, with reduced background contamination due to its offset from the galactic disc.
Recent observations from the Fermi Gamma-ray Space Telescope’s Large Area Telescope (LAT) have highlighted gamma-ray sources associated with SNRs interacting with dense molecular clouds (Abdo et al. 2009a). These sources display steep gamma-ray spectra above a few GeV, possibly influenced by the intricate morphology of the Cygnus Loop, affecting the energy distribution of CRs (Aharonian & Atoyan 1996; Gabici et al. 2009; Torres et al. 2010).
Furthermore, various morphological explanations exist regarding the Cygnus Loop’s nature, with the possibility of hosting one or two supernova remnants. The northern region prominently exhibits shell-like X-ray emissions from thermal plasma, with a blowout in the southern rim (Ku et al. 1984). Non-thermal radio spectra are associated with limb-brightened shells (Keen et al. 1973), while no correlation with dense molecular clouds has been established, potential blast waves on the western limb might interact with molecular material (Scoville et al. 1977). Optically, the Cygnus Loop shows a Balmer Hα shell delineating the SNR’s boundary (Levenson et al. 1999). This thin shell corresponds to a non-radiative shock front moving at approximately 400 km s−1, indicating an early adiabatic phase (Fesen et al. 2018). Strong emission lines and UV emission indicate shock-cloud interactions in the northeastern and western parts of the SNR (Levenson et al. 1999; Fesen et al. 2018).
In radio frequencies, the Cygnus Loop shows two overlapping shell structures aligned in the north-south direction (Uyaniker et al. 2004). The northern radio shell correlates well with the northeast and west optical emissions, while the southern shell’s radio emission lacks correspondence at other wavelengths. Despite similar total-intensity spectra, polarisation characteristics differ, suggesting a scenario involving two separate SNRs (Uyaniker et al. 2003; Sun et al. 2006; West et al. 2016).
In this study, by taking advantage of archival polarisation observations at 2.7 GHz of the region, we investigated the global geometry and turbulent characteristics of the magnetic field. Zhang et al. (2020) and Malik et al. (2023) suggested that the statistics of polarised synchrotron radiation reflect the fluctuations in the embedded magnetic fields caused by the turbulence, which in turn allowed us to study the morphology and properties of the magnetic field. Therefore, we employed the recently developed Y-parameter technique (Malik et al. 2023) based on the relative anisotropy of the synchrotron polarisation along with the modified synchrotron-polarisation-analysis method (SPA, Pavaskar et al. 2024). We performed our MHD turbulence analysis in three sub-regions in the Cygnus Loop to investigate the two-SNR morphology.
The paper is organised as follows. In Sect. 2, we discuss the multi-band radio observations using different facilities. The techniques and statistics used in the analysis are described in Sect. 3. Our detailed analysis and results for all three sub-regions can be found in Sect. 4. We discuss the impact of our results in Sect. 5, and we conclude our paper in Sect. 6.
2. Observational data
Due to its angular positional offset from the galactic disc, the Cygnus Loop enjoys the advantage of being unobscured by galactic dust and other disc emissions. It has been extensively studied across multiple wavelengths, ranging from optical to gamma rays. However, the magnetic-field strength, geometry, and underlying MHD turbulent characteristics of this region remain largely unexplored. Traditional probes such as dust polarisation (Draine 2011), ground-state alignment (Yan & Lazarian 2008a), and the Zeeman effect (Cazzoli et al. 2017) are not viable options for gauging magnetic fields in this environment. Synchrotron polarisation observations in the radio band have revealed intriguing features of the magnetic field in the complex environment of SNRs. While analysing the synchrotron observations in various frequency ranges, recent studies (Uyaniker et al. 2004; Sun et al. 2006, 2021, 2022) have observed unusual polarisation characteristics of these shells.
To investigate the turbulent characteristics of magnetic fields in the Cygnus Loop region, we utilised the Effelsberg 100 m1 observations involving radio continuum and polarisation observations. The data were obtained at a frequency of 2.7 GHz with an angular resolution of ∼4.0 arcmins (Uyanıker et al. 2002). The Cygnus Loop region of interest is the 4.2° ×4.8° region centred at RA ∼ 312.745°, Dec ∼ 30.60°. The extent of the investigated region is mainly constrained from the availability of polarised diffuse observations. The polarised-intensity map is depicted in Fig. 1.
 |
Fig. 1. Observed polarised intensity for the 4.2° ×4.8° Cygnus Loop region from Effelsberg 100 m telescope in waveband centred at 11 cm wavelength from Uyanıker et al. (2002). The three sub-regions –southern, central, and northern– are marked with white, red, and blue dashed lines, respectively. |
Furthermore, to explore the conjecture of two SNR shells, based on the position, we divided the map into three regions. These three sub-regions, named the southern, central, and northern regions, are marked in Fig. 1 with white, red, and blue dashed lines, respectively. A preliminary inspection reveals significant polarised emission in the southern and central shells compared to that of the northern shell. We analysed these sub-regions independently of each other to deduce the geometry and MHD turbulence characteristics.
3. Methodology employed
To probe the geometry and the turbulence properties of the magnetic field in the Cygnus Loop, we utilised techniques such as structure-function analysis (Cho 2019), anisotropy analysis using the Y parameter (Malik et al. 2023, 2024), and modified synchrotron polarisation analysis (SPA+; Pavaskar et al. 2024). All these methods employ the polarisation statistics from synchrotron observations.
3.1. Coherence length using structure function
Due to the presence of intermittent and large-scale fields in ISM and extended objects, it is natural to observe large-scale prominent features that predominate over the small-scale attributes (Houde et al. 2009; Hildebrand et al. 2009; Pattle et al. 2017; Cho 2019). Several approaches have been discussed, such as the fitting method and Wavelet transformation (Grebenev et al. 1995). These techniques strongly depend upon the coarsening of the data. We used well-known and widely used techniques of two-point structure functions to infer the coherence length scale of magnetic field and to identify the length scales dominated by the turbulent fields (Lazarian & Pogosyan 2016). We used the structure function to infer the coherence length scale for the magnetic field in each sub-region, and we do not note a direct correspondence to the turbulence power spectrum. For a plane-of-sky (PoS) observable, X, it is given by
 (1)
(1)
where R′ is the position and R is the PoS separation.  will be an increasing function of R in the regime of small-scale fluctuations (R < Ls) and attain a plateau for R ≳ Ls (Cho 2019). However, the shape of
  is distorted in the presence of large-scale gradients in the observables. We can use three-point structure functions to see the presence of these large-scale variations. The three-point SF is expressed as
 (2)
(2)
To filter out the large-scale fluctuations from the polarised intensity, Ip, we used the annular average technique developed by Cho (2019). It is given by
 (3)
(3)
where  and
and  represents the annular pairwise average at scales in the plateau region that can remove the contribution from large-scale fluctuations (see Cho 2019, for more details), leaving only the small-scale fluctuations in the region. We offset Is by adding standard averaged polarised intensity, ⟨Ip⟩, and used I = Is + ⟨Ip⟩ in subsequent analyses. It represents the polarised intensity mainly dominated by the fluctuations.
3.2. Line-of-sight inclination angle using Y parameter
In our study, we computed the angle between the average magnetic field and the line of sight (LoS) using a new statistical method based on synchrotron polarisation maps called the Y-parameter method (Malik et al. 2023). Previous research has shown that the uneven distribution (anisotropy) of Stokes parameters can reveal information about the geometry of the magnetic field (Yuen et al. 2023). This is achieved by calculating a global correlation function, DX, which can effectively be obtained for any observable, represented by X, as shown in the following equation:
 (4)
(4)
Malik et al. (2023) showed that the Y parameter, which is expressed as
 (5)
(5)
can be used to trace the inclination angle of the magnetic field. Here, Rv and Rh represent the extent of the correlation function distribution estimated from the Gaussian fitting in the vertical and horizontal directions, whereas B⊥ is along the v direction. This statistical parameter, derived from polarised synchrotron radiation, captures the geometry of the mean magnetic field and underlying MHD turbulence characteristics.
The anisotropy of Stokes parameters can act as a diagnostic for retrieving the magnetic-field inclination and identifying the dominating MHD turbulence mode in ISM and extended sources such as the Cygnus Loop region. It is supported by the value space separation of the Y parameter for decomposed Alfvénic (A mode) and compressible (C mode) MHD modes, which decreases and increases with the inclination angle between the mean field and the LoS, θλ, respectively. A statistical demarcation at Yturb ∼ 1.5 (for A mode, Yturb > 1.5; and for C mode, Yturb < 1.5) was used to obtain the dominant fraction of MHD turbulence modes in the region. Additionally, the unique sensitivity of the Yturb parameter to θλ in different MHD-mode-dominated regimes (see Fig. 4 in Malik et al. 2023) allowed us to estimate the θλ in certain morphologies.
As with any method using polarisation observations, the Y-parameter method is also sensitive to Faraday rotation during the propagation. Malik et al. (2023) showed that the technique works effectively where the Faraday rotation and its variance does not exceed ≈50°. To fully assess the impact of foreground Faraday rotation, future Faraday tomography (see, e.g. Takahashi 2023) using multi-wavelength polarisation observations with high statistics will be necessary. We discuss this briefly in Appendix A.
3.3. MHD mode classification using the SPA+ method
In addition to the Y-parameter method, the modified synchrotron-polarisation-analysis method (SPA+, Pavaskar et al. 2024) provides a recipe to differentiate between the MHD modes dominating the turbulent energy in the ISM plasma through polarised synchrotron observations. This can be achieved because the incompressible Alfvén and the compressible magnetosonic MHD modes are oriented orthogonally in 3D space; hence, they are integrated along the LoS (and projected on the PoS) differently. Through numerical tests using 3D ideal MHD simulations, Pavaskar et al. (2024) showed that the projected signatures of the Alfvén and compressible modes are embedded in the polarised synchrotron emissions observed from the magnetised turbulent plasma. A statistical analysis of the observed Stokes parameters allowed us to identify the MHD mode dominating the energy in the plasma.
The SPA+ signature function, defined as sxx(ϕs) = var(ϵ(ϕs)), is computed by step-wise rotation of the Stokes frame by the rotation angle ϕs, where ϵ(ϕs) is the synchrotron emissivity given by
 (6)
(6)
The frame rotation angle, ϕs, is defined such that ϕs = 0deg aligns with the projected mean polarisation angle in the observations. Since ϵ(ϕ) has second-order sine and cosine terms, a general expression for sxx = var(ϵ) for arbitrary ϕs can be written as a fourth-order Fourier sine and cosine series with only even terms (see Fig. 2 in Pavaskar et al. 2024):
 (7)
(7)
By fitting this function to the observed sxx signature, the fit parameters can be used to identify the energy-dominant MHD mode. The cosine terms contribute to the symmetric part and quantify the concavity of the signature, while the sine terms contain the asymmetry. Symmetry, in this context, refers to the axisymmetry of the sxx function around ϕs = 90°. Effectively, the four unique parameters A2, A4, B2, and B4 contain information on the dominant mode fraction in the turbulence. This information can be extracted by quantifying the individual features of the sxx signature through the parameter ratios A4/A2, B2/A2, and B4/A2. The symmetry parameter A4/A2 can identify the energy-dominant mode between the Alfvén (A4/A2 < 0) and compressible modes (A4/A2 > 0). The asymmetry parameters B2/A2 and B4/A2 can identify the presence of fast MHD modes due to the uniquely asymmetric nature of the fast mode signature at large mean-magnetic-field inclination angles. A parameter value of |B4/A2|> 0.6 in addition to the detection of compressible-mode dominance implies a strong possibility of the presence of fast modes and a large mean-magnetic-field inclination (θλ > 45°). Additionally, although the detection of the Alfvén mode and the fast mode at the same location seems contradictory, it has an implication of a small magnetic-field inclination (θλ < 15°), as the SPA+ mode classification scheme does not work in such a case.
4. Analysis and results
Given that the observations are influenced by the large-scale fluctuations, we probed the fluctuation at MHD scales. We evaluated the two- and three-point second-order structure functions for all three regions and used them to estimate scales of dominated turbulence, which are below the coherence length of the 2D magnetic field. Further, we used the Y-parameter analysis based on the relative anisotropy and synchrotron polarisation statistics of the Stokes parameters of polarisation observations to study the geometry of the magnetic field and underlying MHD-dominated mode. To cover the whole region of 4.2° ×4.8°, based on the polarisation feature we decomposed the whole region into three sub-regions (see Fig. 1). The detailed analysis and outcomes of each region are discussed in the subsequent sections.
4.1. Southern region
As is evident from the polarisation observations discussed in the data section (Sect. 2), the southern region of the Cygnus Loop exhibits distinct features with notably high polarised intensity. To gauge the coherence length of the 2D magnetic field, we computed the multi-point structure function for polarised intensity using Eqs. 1 and 2. These structure functions for the southern region are depicted in Fig. 2. Notably, all the structure functions reach saturation near 2 pc, indicating that this scale corresponds to the observed coherence length of the magnetic field and suggests the dominance of MHD turbulence below this scale. Consequently, the scales ranging from the telescope beam size (∼0.85 pc) to the turbulence correlation scale inferred from the structure function break (∼2 pc) were utilised to investigate turbulence characteristics with the anisotropy of polarisation observations, as described in Sect. 3.2.
 |
Fig. 2. Second-order two- and three-point structure functions for the polarised intensity of the southern region. The blue and grey vertical dashed lines indicate the telescopeâs resolution, lb, and coherence length, ls, respectively. The black and blue dashed horizontal lines mark 2σ2 and 2 |

Furthermore, to estimate this relative anisotropy for the correlation functions associated with  and
and  , we generated correlation-function distributions for the southern region, as illustrated in Fig. 3. Markers indicating the direction of the mean magnetic field of the plane of sky, estimated using the angular mean of the polarisation angles shown in Fig. 4, are included in these distributions. Notably, these correlation-function distributions vividly depict differences in horizontal (perpendicular) and vertical (parallel) lengths relative to the mean-magnetic-field direction in the plane of the sky.
 |
Fig. 3. The distribution of the Correlation function for the |


 |
Fig. 4. Distribution of polarisation map in southern zone of Cygnus Loop region. |
To quantify the observed anisotropies, we conducted 2D Gaussian fittings on the distributions by considering the fitting radius close to the correlation length of  . However, to see the variation with fitting radii, we also varied it from lower to higher values as denoted by r in the first column of Table 1. Our analysis yielded a Y-parameter value of approximately Yturb ≈ 0.89. Drawing upon insights from our previous investigation in Malik et al. (2023), a Y-parameter value around Yturb < 1.0 implies a mean-magnetic-field inclination angle of θλ < 10° with respect to the LoS. In order to investigate the sub-block region, we calculated the Y parameter after dividing the southern region into nine spots. The spot size is primarily constrained by the statistics needed to estimate the anisotropy of the correlation function distribution. The dominant modes are plotted on top of the polarised intensity in Fig. 6, where different colours of the circles denote different identified dominant modes. The circle sizes do not represent any physical scales. These findings suggest that the southern shells of the Cygnus Loop SNRs are characterised by compressible-dominated turbulence modes.
Values of Yturb for the southern region.
 |
Fig. 6. Dominant turbulence mode identified by Y-parameter analysis after dividing the southern region into nine spots with the spot size 1/3 of the whole region plotted on the polarised intensity map. The red and green circles show the mode dominance of compressible (Yturb < 1.0) and Alfvén (Yturb > 2.0) modes, respectively. The blue circles indicate ambiguity in dominant mode identification with Yturb values in the range of one to two. |
The analysis using the SPA+ technique is shown in Fig. 5. We chose sub-regions (analysis spots) of 2.5 pc × 2.5 pc for each signature calculation. The analysis is split into two parts. Firstly, the estimation of the energy-dominant mode fraction (shown by the circles in Fig. 5) was performed based on the classification parameter, A4/A2. We distinguished between Alfvén-mode and compressible-mode dominance following the approach proposed in Pavaskar et al. (2024). The colour of the circles represents the mode classifications: green for Alfvén mode and red for compressible mode. Overall, the region seems to be dominated by compressible turbulence (approximately 60% compressible signatures of the total signatures). We note that clusters of spots correlated with the regions of relatively higher polarised intensity, specifically the shell-like structure, correspond to the compressible mode dominant signatures. We also grouped the spots in nine sub-blocks (dotted blue lines) to compare with the Y-parameter spotwise analysis.
 |
Fig. 5. Results from modified SPA+ method plotted on top of the synchrotron polarised-intensity map for Cygnus Loop southern region. Each analysis spot corresponds to the classification obtained from a 2.5 pc × 2.5 pc sub-region. The rings show the identification of the dominant mode from the classification parameter, A4/A2. The red dots show the detection of fast modes through the asymmetry parameter, B4/A2. The green and red colours show the mode dominance of Alfvén and compressible modes, respectively. The regions where the SPA+ mode classification gives mode ambiguity have been removed from the analysis. |
In the second part of the SPA+ technique, we analysed the signature asymmetry to detect the presence of fast modes. This is shown by the red dots in Fig. 5, where the asymmetry of the sxx signature is sufficiently large (|B4/A2|> 0.6) to indicate the presence of fast-mode turbulence. We see that the southern region does not show a significant amount of fast-mode detections. However, this does not necessarily imply the absence of fast modes, as symmetric signatures can also be observed from fast-mode turbulence (see Pavaskar et al. 2024). An energy dominance of compressible modes naturally implies a non-negligible energy of fast modes in the turbulence. Overall, the SPA+ analysis is in agreement with the conclusion from the Y-parameter one, which also predicts the presence of compressible turbulence in the southern region.
4.2. Central region
In several recent studies (Sun et al. 2006, 2021, 2022), the morphology of the Cygnus Loop has led to the suggestion of a combination of two SNRs. Building upon this notion, we approached the analysis of the Cygnus Loop by delineating it into three principal components. As shown in Fig. 1, the central region represents the eastern portion of the source.
As discussed in previous sections, the 2D magnetic field of the plane of the sky plays a pivotal role in synchrotron polarisation emission. To estimate the coherence length and assess the influence of large-scale fluctuations, we extended our analysis to encompass SFs computed up to three points for the polarised intensity. The resulting SFs, depicted in Fig. 7, exhibit a convergence near 2 pc, providing an upper limit for studying the MHD turbulent characteristics and applying techniques based on synchrotron anisotropy.
 |
Fig. 7. Second-order two- and three-point structure functions for the polarised intensity of the central region. The blue and grey dashed vertical lines indicate the telescopeâs beam size, lb, and coherence length, ls, respectively. The black and blue dashed horizontal lines mark 2σ2 and 2 |

Subsequently, Fig. 8 presents the correlation-function distributions of  and
and  for the central region, annotated with markers denoting the direction of the mean magnetic field in the plane of the sky, as determined via the spherical mean of the polarisation angles shown in Fig. 9. These distributions clearly illustrate variations in horizontal and vertical extents relative to the mean magnetic-field direction in the plane of the sky.
 |
Fig. 8. Distribution of correlation function for |


 |
Fig. 9. Distribution of polarisation map in central zone of Cygnus Loop region. |
To quantify these observed anisotropies, we conducted 2D Gaussian fittings on the distributions, confining the fitting radius within the 2D correlation length of 2 pc. Our analysis for the central region gives us the Y-parameter value of approximately Yturb ≈ 0.89. Similar to what we did in the southern region, we also varied the fitting radii, r, to examine their impact on the Y-parameter values, as shown in Table 2. However, we note that the Y values do not change significantly with radius. Drawing from insights gleaned from our prior work (Malik et al. 2023), a Y-parameter value near Yturb ∼ 1.0 implies a mean magnetic-field inclination angle of θλ < 10°. Furthermore, we calculated the Y parameter after sub-dividing this region into nine sub-blocks and plotted the results at the top of the polarised intensity as shown in Fig. 11 These findings suggest that compressible turbulence modes predominate in the central region on the eastern side of the upper shell of the Cygnus Loop’s SNR.
Values of Yturb for the central sub-region.
 |
Fig. 11. Dominant turbulence mode identified by Y-parameter analysis after dividing the central region into nine spots with the spot size 1/3 of the whole region plotted on the polarised intensity map. The red circles show the mode dominance of compressible modes, whereas the blue circles indicate ambiguity regarding dominant-mode identification with Yturb values in the range of one to two. |
We followed the SPA+ procedure similar to that employed for the southern region to try to recover the dominant MHD mode in the central region. The spot analysis results are shown in Fig. 10. These spots were also divided into nine groups in order to compare them with the Y-parameter spot analysis. The SPA+ analysis is inconclusive in this region, owing to the approximately equal number of observed Alfvén and compressible signatures. The signatures are also fairly axisymmetric, meaning that we are not able to conclude on the presence of fast modes. Since the Y-parameter analysis reveals a low magnetic-field inclination angle, the SPA+ signatures might be affected due to the lack of a sufficiently large PoS magnetic-field component. A comparison of both these techniques shows that they closely identify the same dominant modes, except for the ambiguous mode results in the Y parameter, which are identified as Alfvén dominant in SPA+. Thus, the central and southern regions closely follow the same morphology and are associated with the same SNR.
 |
Fig. 10. Results from modified SPA+ method plotted on top of synchrotron-intensity map for the Cygnus Loop central region. Each analysis spot corresponds to the classification obtained from a 2.5 pc × 2.5 pc sub-region. The rings show the identification of the dominant mode from the classification parameter, A4/A2. The red dots show the detection of fast modes through the asymmetry parameter, B4/A2. The green and red colours show the mode dominance of Alfvén and compressible modes, respectively. The regions where the SPA+ mode classification gives mode ambiguity have been removed from the analysis. |
4.3. Northern region
The northern sub-region is the area in the northwest of the Cygnus Loop’s upper shell. We indicate the region of 25 × 25 pc in Fig. 1. To follow a similar procedure to that used in the southern and central regions, we calculated the multi-point structure function of the polarised intensity. We plot the two- and three-point SFs in Fig. 12 that we used to infer the coherence length. As marked by the vertical black dashed line of ls, the coherence length of the magnetic field can be approximated by 2 pc. As illustrated earlier, by taking length scales smaller than the coherence length, we estimated the lowest value of Yturb ∼ 1.06 by fitting the correlation function distribution shown in Fig. 13. We also marked the v and h directions parallel and perpendicular to the mean field direction estimated by taking the spherical mean of the polarisation map shown in Fig. 14. As we increase the fitting radii (see Table 3), it further increases towards 1.5. Using the classification criteria obtained in Malik et al. (2023), we can suggest that the northern region has ambiguous turbulence modes and θλ > 60°.
 |
Fig. 12. Second-order two- and three-point structure functions for the polarised intensity of the northern region. The blue and grey dashed vertical lines indicate the telescope’s beam size, lb, and coherence length, ls, respectively. The black and blue dashed horizontal lines mark 2σ2 and 2 |

 |
Fig. 13. Distribution of correlation function for |


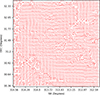 |
Fig. 14. Distribution of polarisation map in northern zone of Cygnus Loop region. |
Values of Yturb for the northern sub-region.
An analysis using the SPA+ method yields a similar result to that of the Y-parameter method. The results are shown in Fig. 15. In general, the SPA+ technique identifies the compressible modes in the central section of the northern region with the Alfvén modes in the periphery, although with no clear identification of the energy dominance for the entire region. The lack of fast modes also means that an estimation of the magnetic-field inclination angle cannot be concluded from the SPA+ method. It is clear from the total intensity map of the Cygnus Loop (see Fig. 1) that the northern region is the faintest of the three selected regions. Since the SPA+ method primarily relies on the availability of sufficiently large statistics, the mode identification in the northern region might be unreliable.
 |
Fig. 15. Results from modified SPA+ method plotted on top of synchrotron-intensity map for the Cygnus Loop’s northern region. Each analysis spot corresponds to the classification obtained from a 2.5 pc × 2.5 pc sub-region. The rings show the identification of the dominant mode from the classification parameter, A4/A2. The red dots show the detection of fast modes through the asymmetry parameter, B4/A2. The green and red colours show the mode dominance of Alfvén and compressible modes, respectively. The regions where the SPA+ mode classification leads to mode ambiguity have been removed from the analysis. |
Additionally, when we performed the Y-parameter spot analysis (shown in Fig. 16) similarly what was done for the southern and central regions and compared with the SPA+ spot group shown in Fig. 15, we note that the ambiguous Y-parameter results (blue circle) are found to be in Alfen-dominant mode for SPA+. Whereas the compressible dominant mode in the Y parameter shown by red circles also appears to be compressible-dominant in SPA+ results. Even though it is difficult to conclude on the whole northern region because of weak polarised intensity, the spot-wise analysis from both techniques helps us to understand the underlying MHD turbulence nature.
 |
Fig. 16. Dominant turbulence mode identified by Y-parameter analysis after dividing the northern region into nine spots with the spot size 1/3 of the whole region plotted on the polarised intensity map. The red circles show the mode dominance of compressible modes, whereas the blue circles indicate ambiguity in dominant-mode identification with Yturb values in the range of one to two. |
4.4. Combined outcomes
Our analysis of the extended regions within the complex structure of the Cygnus Loop employed three statistically developed techniques: structure-function analysis, relative anisotropy of Stokes parameters, and modified SPA. We report the following outcomes.
-
The multi-point structure-function analysis of polarised intensity could serve as a potent tool for inferring the coherence length of the 2D magnetic field. We report that all three sub-regions have coherence lengths of ∼2 pc. This gives us a clear indication of the turbulence-dominant length scales and could potentially be used to understand the CR and gamma-ray emission from the region.
-
The Y-parameter analysis shows that the southern and central regions with Yturb < 1.0 suggest a mean magnetic-field inclination angle of θλ < 10°, which is closely aligned with the line of sight to the observer. It also highlights that these two sub-regions have similar underlying compressible turbulence-dominant modes that could be one of the prominent CR’s acceleration and contribute to the high-energy emission. The northern region shows distinct characteristics with Yturb > 1.0 and θλ > 60° and ambiguous results for identification of dominant mode (see Table 4).
-
The distinct polarisation features along with anisotropy results suggest that the Cygnus Loop has complex structural morphology, which is possibly due to the association of two SNR shells. The difference in the Yturb between the northern and southern/central part supports previous ideas that the Cygnus Loop consists of two remnants.
-
The SPA+ method has been used to identify the MHD mode dominating the turbulent energy in the plasma. All three sub-regions in the Cygnus Loop seem to be largely dominated by Alfvénic turbulence. However, the southern and central regions show a compressible mode, which corresponds to the shell-like outer structure. The large value of both classification and asymmetry parameters, A4/A2 and B4/A2, implies a small magnetic-field inclination angle of θλ < 15°, which is in agreement with the conclusion from the Y-parameter analysis. The intensity in the northern region is too low to make a conclusive estimation of the presence of compressible modes or the magnetic-field inclination angle.
-
There is no direct delineation between the SPA+ and Y-parameter results in the multi-spot analysis. Moreover, the spot-wise Y-parameter analysis for all three regions is largely in agreement with the grouped-spot SPA+ analysis. Specifically, for the southern region, more than 60% of compressible modes were identified from the SPA+ analysis (see Fig. 5), which is similar to the results shown in Fig. 6.
Quantities estimated in this study.
5. Discussion
The study of SNRs serves as a robust laboratory for investigating cosmic-ray acceleration and scattering processes at shocks and within MHD turbulence. Extensive discussions in the literature (Schlickeiser 2002; Yan & Lazarian 2002; Yan et al. 2008; Lemoine 2022; Yan 2022) have underscored the pivotal role played by the turbulent characteristics of the magnetic field in facilitating various physical processes, including particle transport and acceleration. Consequently, a comprehensive understanding of the underlying magnetic-field configuration and the nature of associated turbulence holds significant promise for elucidating cosmic-ray diffusion and multi-wavelength emissions from the Cygnus Loop and similar structures.
Previous studies (Fürst & Reich 2004; Shimoda 2022 and references therein) have extensively reviewed observations of polarised radio emissions from SNRs and have analysed these emissions to deduce intrinsic magnetic fields and their turbulent characteristics. These studies have revealed that the magnetic-field characteristics depend on the dynamical evolution of the SNRs, categorizing them mainly as young shells, evolved shells, and filled-centre SNRs. Similarly, global structures of the magnetic field in SNRs have been measured through radio synchrotron polarimetry (Dickel & Milne 1976; Dickel et al. 1991; Diesing & Caprioli 2018; Dubner & Giacani 2015), although the 3D geometry of global magnetic fields and dominant MHD turbulence modes remains an open question.
The recent work by Malik et al. (2023) enables the study of magnetic-field geometry via statistics of Stokes parameters. The theoretical and numerical advancement from Malik et al. (2023) is based on a very simple principle, that the statistics of Stokes Q and U behave differently when the mean magnetic-field orientation changes with respect to the line of sight. The new method was used and verified in later publications, with Malik et al. (2024) showing the robustness of the technique. However, the new technique by Malik et al. (2023) was developed in the presence of only very weak Faraday rotation. While employing the new methods, we focused on the 11 cm observations, which have reliable resolution and minimise the Faraday rotation implications. The synergistic application of the improved SPA+ technique (Pavaskar et al. 2024) also help in the quantification of the physical parameters of the SNR. In particular, the presence of strong compressible modes further strengthens the prediction coming from the technique from Malik et al. (2023). While both these methods are capable of separating the turbulent modes from polarised synchrotron observations, they have a few fundamental differences. The SPA+ method relies on the simple fact that the B-field fluctuations in compressible and incompressible modes are orthogonal to each other in 3D space, which means they are projected on the plane-of-sky and integrated along the line of sight uniquely. We used the variance of the emissivity of the arising polarised synchrotron emission as a proxy for the dispersion of the plane of sky component of the magnetic field, which is embedded with the information of the projected modes. The usage of single-point statistics makes the method less vulnerable to effects such as foreground Faraday rotation varying in the plane of sky, but it also adds other requirements such as a maximum threshold on θλ. The Y-parameter method utilises the fact that the modes show unique anisotropies in the two-point correlation distribution in the plane of sky. This makes the Y-parameter method more robust in all B-field orientations (which is highly relevant for follow-up studies modelling the cosmic/gamma-ray emissions from the Cygnus Loop region). Thus, we synergised the two methods to provide a more complete analysis of the turbulent modes in our observations. Furthermore, we noticed that there is no direct delineation between the two methods; particularly, in the multi-spot analysis, the spot-to-spot comparison would not be feasible. In all the sub-regions, our primary focus is on the findings of the Y-parameter method, and the SPA+ method is used simply as a complement.
As illustrated in the preceding sections, the structure-function analysis of polarised intensity indicates a coherence length of ∼2 pc, which closely aligns with the observed coherence length in a recent study of the Monogem PWN (Malik et al. 2024). By investigating the slope of these two-point structure functions of polarised intensity could possibly suggest that the turbulence is in the Kolmogorov framework. However, we should be careful inferring the spectral index of turbulence from the polarised intensity due to reason of its dependence on the non-thermal electron density. Moreover, the available spatial resolution is another limiting factor in analysing the slope in our case. Notably, the similarity in coherence length between our analyses of PWNe and SNRs suggests common underlying turbulent characteristics in the vicinity of these sources. Furthermore, these investigations can provide validation of the role of MHD turbulence in accelerating and scattering cosmic-ray particles, thereby justifying high-energy (GeV-TeV) observations from the direction of these sources.
Katagiri et al. (2011) presented observations from the Fermi Large Area Telescope of the Cygnus Loop region, revealing significant gamma-ray emissions associated with the SNR in the energy band of 0.2 − 100 GeV. Furthermore, they highlighted credible evidence indicating that these emissions originate from regions where SNR shells interact with dense molecular clouds (Abdo et al. 2009b,a). However, these features could also arise from the re-acceleration of pre-existing CRs at cloud boundaries and subsequent compression induced by MHD turbulence waves. In prominent studies (Yan & Lazarian 2004, 2008b), it has been established that compressible turbulence modes can significantly influence the acceleration and streaming of cosmic rays.
Given the ongoing efforts to observe the Cygnus Loop in the TeV range using facilities such as LHAASO and others, the analysis conducted in this study to investigate MHD turbulence in the three principal components of the Cygnus Loop region can be instrumental. Our findings indicate that the southern and central regions exhibit compressible dominant modes with low-inclination angles of the mean magnetic field. This suggests that existing models for GeV-TeV emission, such as those proposed by Katagiri et al. (2011) and Liu et al. (2019), could be tested and refined based on our results.
6. Conclusion
In this study, we investigated the magnetic-field geometry and turbulent characteristics of the magnetic fields in the Cygnus Loop using synchrotron polarisation observations. To facilitate our analysis, we divided the loop into three shells: the northern, central, and southern blowout regions. Due to resolution constraints and to minimise the impact of Faraday rotation on our study, we utilised observations from wave bands centred at 11 cm from the Effelsberg telescope.
Based on our work using the structure-function, anisotropy-based Y-parameter and modified SPA+ techniques, we draw the following conclusion.
-
The analysis of structure functions reveals that all three regions exhibit similar observed coherence lengths of the magnetic field, approximately around 2 pc.
-
The Y-parameter study indicates that the southern and central regions (Y ∼ 0.89) are dominated by compressible modes and show mean magnetic-field inclination angles of θ < 10°.
-
The spot-wise Y-parameter analysis for the southern region and the SPA+ analysis identified more than 60% of compressible modes, and they also agree with each other.
-
For the northern region (Yturb ∼ 1.06), the Y-parameter method yields ambiguous results, potentially influenced by the dispersion of Faraday rotation in the region.
-
Our analysis based on radio polarisation observations suggests that the morphology of the Cygnus Loop comprises two overlapping shell structures, possibly representing two SNRs, where respective shock waves interact at the boundary of the northern and central regions.
-
Analysis based on the modified synchrotron-polarisation-analysis method supports the observation from the Y parameter of the presence of compressible-mode-dominant sub-regions in the central and southern regions and is also in agreement with the conclusion of a low magnetic-field inclination angle. The northern region predominantly shows Alfvén signatures with no clear presence of compressible modes.
In conclusion, our study offers a comprehensive diagnostic of the magnetic field, shedding light on the intricate physical processes underlying SNRs and their recent and future high-energy emissions from the shells.
Acknowledgments
We thank the anonymous referee for valuable comments that significantly improved the paper. SM thank Patricia Reich and Wolfgang Reich for sharing the 11 and 6 cm polarisation datasets for the Cygnus Loop region.
References
- Abdo, A. A., Ackermann, M., Ajello, M., et al. 2009a, ApJS, 183, 46 [NASA ADS] [CrossRef] [Google Scholar]
- Abdo, A. A., Allen, B. T., Aune, T., et al. 2009b, ApJ, 700, L127 [CrossRef] [Google Scholar]
- Aharonian, F. A., & Atoyan, A. M. 1996, A&A, 309, 917 [Google Scholar]
- Beresnyak, A., & Lazarian, A. 2015, Astrophys. Space Sci. Libr., 407, 163 [Google Scholar]
- Boulares, A., & Cox, D. P. 1990, ApJ, 365, 544 [NASA ADS] [CrossRef] [Google Scholar]
- Cazzoli, G., Lattanzi, V., Coriani, S., et al. 2017, A&A, 605, A20 [NASA ADS] [CrossRef] [EDP Sciences] [Google Scholar]
- Cho, J. 2019, ApJ, 874, 75 [Google Scholar]
- Dickel, J. R., & Milne, D. K. 1976, Austr. J. Phys., 29, 435 [Google Scholar]
- Dickel, J. R., van Breugel, W. J. M., & Strom, R. G. 1991, AJ, 101, 2151 [NASA ADS] [CrossRef] [Google Scholar]
- Diesing, R., & Caprioli, D. 2018, Phys. Rev. Lett., 121, 091101 [Google Scholar]
- Draine, B. T. 2011, Physics of the Interstellar and Intergalactic Medium [Google Scholar]
- Dubner, G., & Giacani, E. 2015, A&ARv, 23, 3 [Google Scholar]
- Ferrière, K. M. 2001, Rev. Modern Phys., 73, 1031 [CrossRef] [Google Scholar]
- Fesen, R. A., Weil, K. E., Cisneros, I. A., Blair, W. P., & Raymond, J. C. 2018, MNRAS, 481, 1786 [Google Scholar]
- Fürst, E., & Reich, W. 2004, in The Magnetized Interstellar Medium, eds. B. Uyaniker, W. Reich, & R. Wielebinski, 141 [Google Scholar]
- Gabici, S., Aharonian, F. A., & Casanova, S. 2009, MNRAS, 396, 1629 [Google Scholar]
- Girichidis, P., Naab, T., Hanasz, M., & Walch, S. 2018, MNRAS, 479, 3042 [NASA ADS] [CrossRef] [Google Scholar]
- Grebenev, S. A., Forman, W., Jones, C., & Murray, S. 1995, ApJ, 445, 607 [Google Scholar]
- Habegger, R., Ho, K. W., Yuen, K. H., & Zweibel, E. G. 2024, arXiv e-prints [arXiv:2403.07976] [Google Scholar]
- Hildebrand, R. H., Kirby, L., Dotson, J. L., Houde, M., & Vaillancourt, J. E. 2009, ApJ, 696, 567 [Google Scholar]
- Holguin, F., Ruszkowski, M., Lazarian, A., Farber, R., & Yang, H. Y. K. 2019, MNRAS, 490, 1271 [NASA ADS] [CrossRef] [Google Scholar]
- Hopkins, P. F., Wetzel, A., Kereš, D., et al. 2018, MNRAS, 480, 800 [NASA ADS] [CrossRef] [Google Scholar]
- Houde, M., Vaillancourt, J. E., Hildebrand, R. H., Chitsazzadeh, S., & Kirby, L. 2009, ApJ, 706, 1504 [Google Scholar]
- Katagiri, H., Tibaldo, L., Ballet, J., et al. 2011, ApJ, 741, 44 [NASA ADS] [CrossRef] [Google Scholar]
- Keen, N. J., Wilson, W. E., Haslam, C. G. T., Graham, D. A., & Thomasson, P. 1973, A&A, 28, 197 [NASA ADS] [Google Scholar]
- Ku, W. H. M., Kahn, S. M., Pisarski, R., & Long, K. S. 1984, ApJ, 278, 615 [Google Scholar]
- Lazarian, A., & Pogosyan, D. 2016, ApJ, 818, 178 [NASA ADS] [CrossRef] [Google Scholar]
- Lemoine, M. 2022, Phys. Rev. Lett., 129, 215101 [NASA ADS] [CrossRef] [Google Scholar]
- Levenson, N. A., Graham, J. R., & Snowden, S. L. 1999, ApJ, 526, 874 [Google Scholar]
- Liu, R.-Y., Yan, H., & Zhang, H. 2019, Phys. Rev. Lett., 123, 221103 [Google Scholar]
- Malik, S., Yuen, K. H., & Yan, H. 2023, MNRAS, 524, 6102 [Google Scholar]
- Malik, S., Yuen, K. H., & Yan, H. 2024, ApJ, 965, 65 [Google Scholar]
- McKee, C. F., & Ostriker, J. P. 1977, ApJ, 218, 148 [NASA ADS] [CrossRef] [Google Scholar]
- Pattle, K., Ward-Thompson, D., Berry, D., et al. 2017, ApJ, 846, 122 [Google Scholar]
- Pavaskar, P., Yuen, K. H., Huirong, Y., & Malik, S. 2024, ApJ, 971 [Google Scholar]
- Reynolds, S. P., Gaensler, B. M., & Bocchino, F. 2012, Space Sci. Rev., 166, 231 [NASA ADS] [CrossRef] [Google Scholar]
- Schlickeiser, R. 2002, Cosmic Ray Astrophys., 183 [Google Scholar]
- Scoville, N. Z., Irvine, W. M., Wannier, P. G., & Predmore, C. R. 1977, ApJ, 216, 320 [Google Scholar]
- Shimoda, J. 2022, Front. Astron. Space Sci., 9, 882467 [Google Scholar]
- Shimoda, J., & Inutsuka, S.-I. 2022, ApJ, 926, 8 [NASA ADS] [CrossRef] [Google Scholar]
- Sun, X. H., Reich, W., Han, J. L., Reich, P., & Wielebinski, R. 2006, A&A, 447, 937 [NASA ADS] [CrossRef] [EDP Sciences] [Google Scholar]
- Sun, X.-H., Meng, M.-N., Gao, X.-Y., et al. 2021, Res. Astron. Astrophys., 21, 282 [Google Scholar]
- Sun, X.-H., Gao, X.-Y., Reich, W., et al. 2022, Res. Astron. Astrophys., 22, 125011 [Google Scholar]
- Takahashi, K. 2023, PASJ, 75, S50 [Google Scholar]
- Torres, G., Andersen, J., & Giménez, A. 2010, A&ARv, 18, 67 [Google Scholar]
- Uyanıker, B., Reich, W., Yar, A., Kothes, R., & Fürst, E. 2002, A&A, 389, L61 [NASA ADS] [CrossRef] [EDP Sciences] [Google Scholar]
- Uyaniker, B., Landecker, T. L., Gray, A. D., & Kothes, R. 2003, ApJ, 585, 785 [Google Scholar]
- Uyaniker, B., Reich, W., Yar-Uyaniker, A., Kothes, R., & Fürst, E. 2004, in The Magnetized Interstellar Medium, eds. B. Uyaniker, W. Reich, & R. Wielebinski, 153 [Google Scholar]
- West, J., Safi-Harb, S., Reichardt, I., et al. 2016, Supernova Remnants: An Odyssey in Space after Stellar Death, 35 [Google Scholar]
- Yan, H. 2022, 37th International Cosmic Ray Conference, 38 [Google Scholar]
- Yan, H., & Lazarian, A. 2002, Phys. Rev. Lett., 89, 281102 [NASA ADS] [CrossRef] [Google Scholar]
- Yan, H., & Lazarian, A. 2004, ApJ, 614, 757 [NASA ADS] [CrossRef] [Google Scholar]
- Yan, H., & Lazarian, A. 2008a, ApJ, 677, 1401 [CrossRef] [Google Scholar]
- Yan, H., & Lazarian, A. 2008b, ApJ, 673, 942 [NASA ADS] [CrossRef] [Google Scholar]
- Yan, H., Lazarian, A., & Petrosian, V. 2008, ApJ, 684, 1461 [Google Scholar]
- Yan, H., Lazarian, A., & Schlickeiser, R. 2012, ApJ, 745, 140 [NASA ADS] [CrossRef] [Google Scholar]
- Yuen, K. H., Yan, H., & Lazarian, A. 2023, MNRAS, 521, 530 [Google Scholar]
- Yuen, K. H., Ho, K. W., Law, C. Y., & Chen, A. 2024, Rev. Mod. Plasma Phys., invited review [arXiv:2404.19101] [Google Scholar]
- Zhang, H., Chepurnov, A., Yan, H., et al. 2020, Nat. Astron., 4, 1001 [NASA ADS] [CrossRef] [Google Scholar]
Appendix A: Impact of foreground Faraday rotation on Cygnus-Loop analysis
As we have discussed in Sect. 3.2, the synchrotron polarisation observations might get affected when they transverse through the foreground Faraday medium having turbulent magnetic fields. In (Malik et al. 2023), while investigating this effect using the synthetic polarisation observation, we noted that the Faraday rotation has a large impact on Yturb particularly on the ambiguous range of 1 < Yturb < 2. Whereas, in other regime its impact is not significantly affecting our analysis. To retrieve the Faraday rotation in the Cygnus loop region, we have tried compilation of the multi-band observation from different telescope facilities.
In past studies (Sun et al. 2006, 2021, 2022), Cygnus Loop region has also been observed in other wavelength bands of 23 and 6 cm from facilities of the Five-hundred-meter Aperture Spherical radio Telescope (FAST2) and Urumqi-25m3, respectively. We have shown these maps in Fig. A.1. These observations in different wavelength bands are from different telescope facilities having significantly different resolutions and noise levels. The extent of region covered in these maps is 5° ×5° and 4.2° ×4.8° for 23 cm and 6 cm, respectively. The distinct polarisation features among three different subregions are clearly visible in these observations.
Further, we noted that these three wavelength observations are averaged over different bandwidths in their respective wavebands. In addition, to derive the rotation measure map using these observations, we need to convolute the 23 cm observation at the resolution of other band observations. Therefore, there are several sources of uncertainties in the rotation measure estimation. To minimise the effect of uncertainties, we have used the Rotation Measure map developed by Sun et al. (2022). The authors used polarisation observations from FAST in the frequency range of 1.03 − 1.46 GHz centered at 23 cm to develop the RM as shown in Fig. 3 in Sun et al. (2006). From that RM map, it has a median RM of ∼ − 20 rad m−2, indicating substantial Faraday rotation affecting the 23 cm polarisation observations and rendering the anisotropy analysis unreliable. However, the 6 cm polarisation observations exhibit weaker influence from Faraday rotation, while due to the poor resolution of 10′, 6 cm observations do not have sufficient statistics. Consequently, we prioritize the use of 11 cm polarisation data in our study to trace magnetic field inclination angles and underlying MHD turbulence across all three sub-regions of the Cygnus Loop.
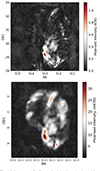 |
Fig. A.1. Upper panel: 5° ×5° map of polarised intensity observed from FAST at the centered wavelength of 23 cm for the Cygnus Loop region (Sun et al. 2022). Lower panel: Map of the observed polarised intensity for 4.2° ×4.8° extent for the loop region from the Urumqi-25m telescope at 6 cm wavelength from Sun et al. (2006). |
To establish the applicability of our techniques of Y-parameter and SPA+ on the 11 cm synchrotron polarisation map, we consider the fragmented RM map in Sun et al. (2006) with a median RM of approximately 20 rad m−2. We estimate the Faraday rotation (θFR) to be of the order of 13°. This rotation caused by the foreground Faraday medium is within the acceptable limit of (< 50°) obtained using synthetic polarisation observations, validating the reliability of the Y-parameter technique. Furthermore, it has been noted by Pavaskar et al. (2024) that uniform Faraday rotation within the spot size (∼ls) does not significantly impact SPA+, and that only the nonuniform FR has an impact on the observed signatures. Another caveat is that the FR causes the compressible turbulence to be identified as Alfvénic turbulence, but this error in unidirectional. Consequently, the identification of compressible modes by the technique is robust. Thus, the techniques used in our analysis are reliable in the Cygnus loop analysis.
All Tables
All Figures
|
Fig. 1. Observed polarised intensity for the 4.2° ×4.8° Cygnus Loop region from Effelsberg 100 m telescope in waveband centred at 11 cm wavelength from Uyanıker et al. (2002). The three sub-regions –southern, central, and northern– are marked with white, red, and blue dashed lines, respectively. |
| In the text | |
|
Fig. 2. Second-order two- and three-point structure functions for the polarised intensity of the southern region. The blue and grey vertical dashed lines indicate the telescopeâs resolution, lb, and coherence length, ls, respectively. The black and blue dashed horizontal lines mark 2σ2 and 2 |
| In the text | |
|
Fig. 3. The distribution of the Correlation function for the |
| In the text | |
|
Fig. 4. Distribution of polarisation map in southern zone of Cygnus Loop region. |
| In the text | |
|
Fig. 6. Dominant turbulence mode identified by Y-parameter analysis after dividing the southern region into nine spots with the spot size 1/3 of the whole region plotted on the polarised intensity map. The red and green circles show the mode dominance of compressible (Yturb < 1.0) and Alfvén (Yturb > 2.0) modes, respectively. The blue circles indicate ambiguity in dominant mode identification with Yturb values in the range of one to two. |
| In the text | |
|
Fig. 5. Results from modified SPA+ method plotted on top of the synchrotron polarised-intensity map for Cygnus Loop southern region. Each analysis spot corresponds to the classification obtained from a 2.5 pc × 2.5 pc sub-region. The rings show the identification of the dominant mode from the classification parameter, A4/A2. The red dots show the detection of fast modes through the asymmetry parameter, B4/A2. The green and red colours show the mode dominance of Alfvén and compressible modes, respectively. The regions where the SPA+ mode classification gives mode ambiguity have been removed from the analysis. |
| In the text | |
|
Fig. 7. Second-order two- and three-point structure functions for the polarised intensity of the central region. The blue and grey dashed vertical lines indicate the telescopeâs beam size, lb, and coherence length, ls, respectively. The black and blue dashed horizontal lines mark 2σ2 and 2 |
| In the text | |
|
Fig. 8. Distribution of correlation function for |
| In the text | |
|
Fig. 9. Distribution of polarisation map in central zone of Cygnus Loop region. |
| In the text | |
|
Fig. 11. Dominant turbulence mode identified by Y-parameter analysis after dividing the central region into nine spots with the spot size 1/3 of the whole region plotted on the polarised intensity map. The red circles show the mode dominance of compressible modes, whereas the blue circles indicate ambiguity regarding dominant-mode identification with Yturb values in the range of one to two. |
| In the text | |
|
Fig. 10. Results from modified SPA+ method plotted on top of synchrotron-intensity map for the Cygnus Loop central region. Each analysis spot corresponds to the classification obtained from a 2.5 pc × 2.5 pc sub-region. The rings show the identification of the dominant mode from the classification parameter, A4/A2. The red dots show the detection of fast modes through the asymmetry parameter, B4/A2. The green and red colours show the mode dominance of Alfvén and compressible modes, respectively. The regions where the SPA+ mode classification gives mode ambiguity have been removed from the analysis. |
| In the text | |
|
Fig. 12. Second-order two- and three-point structure functions for the polarised intensity of the northern region. The blue and grey dashed vertical lines indicate the telescope’s beam size, lb, and coherence length, ls, respectively. The black and blue dashed horizontal lines mark 2σ2 and 2 |
| In the text | |
|
Fig. 13. Distribution of correlation function for |
| In the text | |
|
Fig. 14. Distribution of polarisation map in northern zone of Cygnus Loop region. |
| In the text | |
|
Fig. 15. Results from modified SPA+ method plotted on top of synchrotron-intensity map for the Cygnus Loop’s northern region. Each analysis spot corresponds to the classification obtained from a 2.5 pc × 2.5 pc sub-region. The rings show the identification of the dominant mode from the classification parameter, A4/A2. The red dots show the detection of fast modes through the asymmetry parameter, B4/A2. The green and red colours show the mode dominance of Alfvén and compressible modes, respectively. The regions where the SPA+ mode classification leads to mode ambiguity have been removed from the analysis. |
| In the text | |
|
Fig. 16. Dominant turbulence mode identified by Y-parameter analysis after dividing the northern region into nine spots with the spot size 1/3 of the whole region plotted on the polarised intensity map. The red circles show the mode dominance of compressible modes, whereas the blue circles indicate ambiguity in dominant-mode identification with Yturb values in the range of one to two. |
| In the text | |
|
Fig. A.1. Upper panel: 5° ×5° map of polarised intensity observed from FAST at the centered wavelength of 23 cm for the Cygnus Loop region (Sun et al. 2022). Lower panel: Map of the observed polarised intensity for 4.2° ×4.8° extent for the loop region from the Urumqi-25m telescope at 6 cm wavelength from Sun et al. (2006). |
| In the text | |
Current usage metrics show cumulative count of Article Views (full-text article views including HTML views, PDF and ePub downloads, according to the available data) and Abstracts Views on Vision4Press platform.
Data correspond to usage on the plateform after 2015. The current usage metrics is available 48-96 hours after online publication and is updated daily on week days.
Initial download of the metrics may take a while.