Fig. 9
Download original image
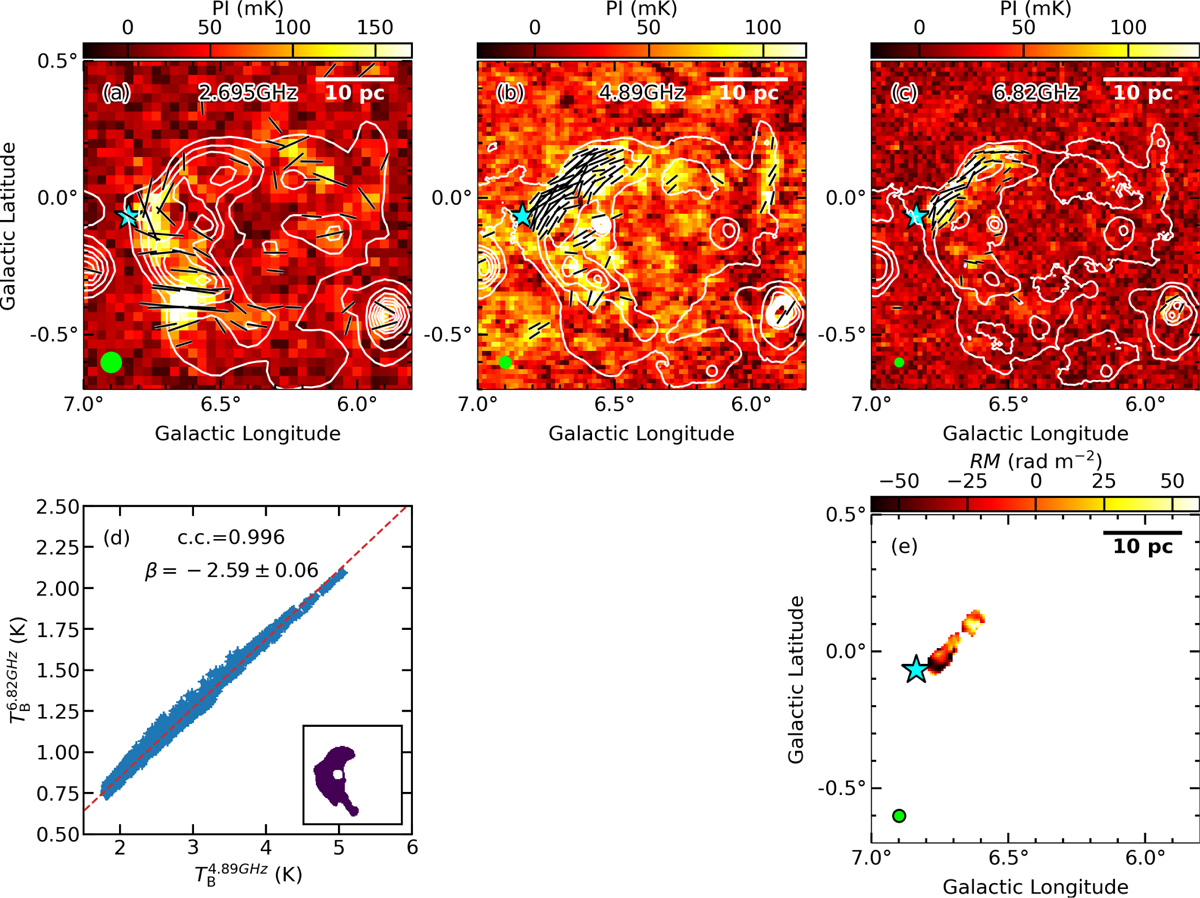
GLOSTAR radio continuum data of W28. (a) Linear polarization intensity maps overlaid with the magnetic-field vectors from the 2.695 GHz Effelsberg Galactic plane survey. The white contours represent the 2.695 GHz Stokes I continuum emission, starting at 2.5 K and increasing in steps of 2.5 K. (b) Similar to panel a, but using GLOSTAR 4.89 GHz continuum data, with white contours starting at 1.0 K and increasing in steps of 1.0 K. (c) Similar to panel a, but based on GLOSTAR 6.82 GHz continuum data, where white contours start at 0.5 K and increase in steps of 0.5 K. In panels a–c, the polarization angles are rotated by 90° to trace the magnetic-field directions, indicated by black bars. The position of the runaway pulsar PSR B1758−23 (i.e., PSR J1801−23), thought to be associated with W28 (Frail et al. 1993), is indicated by a cyan star. In each panel, the beam is shown in the lower-left corner, and the scale bar in the top-right corner is based on an assumed distance of 2 kpc (Velázquez et al. 2002). (d) TT plot of the northeastern shell between 4.89 GHz and 6.82 GHz at a common angular resolution of 160′′. The dashed red line shows the best fit to the observed data points extracted from the region displayed in the panel in the lower right corner. (e) Distribution of the derived RMs.
Current usage metrics show cumulative count of Article Views (full-text article views including HTML views, PDF and ePub downloads, according to the available data) and Abstracts Views on Vision4Press platform.
Data correspond to usage on the plateform after 2015. The current usage metrics is available 48-96 hours after online publication and is updated daily on week days.
Initial download of the metrics may take a while.