Fig. 8
Download original image
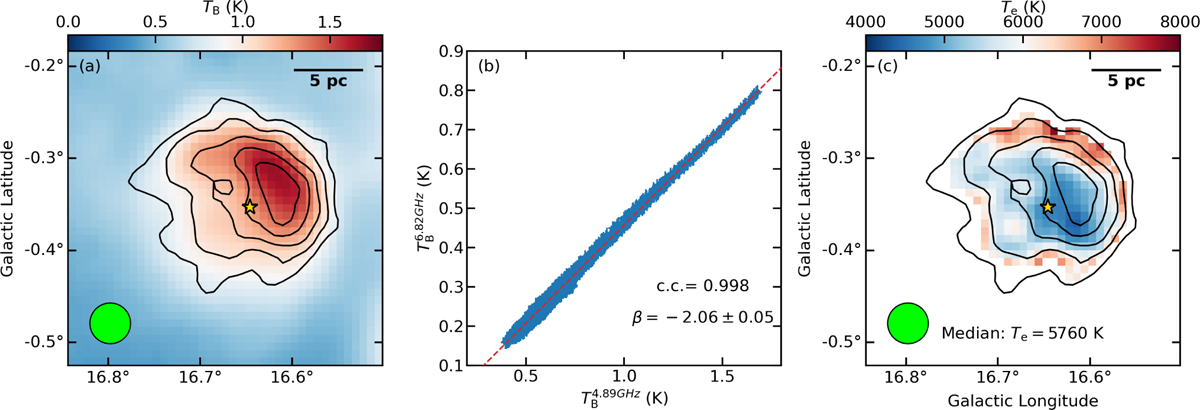
Observed properties of G016.648−00.357 (i.e., Sh 2-48). (a) Effelsberg 4.89 GHz Stokes I image overlaid with the GDIGS RRL integrated-intensity contours. (b) TT plot between 4.89 GHz and 6.82 GHz at a common angular resolution of 2′.65. The dashed red line shows the best fit to the observed data points. (c) Spatial distribution of the derived electron temperatures overlaid with the GDIGS RRL integrated-intensity contours. In panels (a) and (c), the integrated velocity ranges from 0 to 70 km s−1 for the GDIGS RRL integrated intensity contours, starting at 1 K km s−1 and increasing by 0.5 K km s−1. The location of the exciting star BD−14 5014 is marked with a gold star. In each panel, the beam is shown in the lower-left corner, and the scale bar in the top-right corner is based on an assumed distance of 3.8 kpc (e.g., Ortega et al. 2013; Torii et al. 2021).
Current usage metrics show cumulative count of Article Views (full-text article views including HTML views, PDF and ePub downloads, according to the available data) and Abstracts Views on Vision4Press platform.
Data correspond to usage on the plateform after 2015. The current usage metrics is available 48-96 hours after online publication and is updated daily on week days.
Initial download of the metrics may take a while.