Fig. 5
Download original image
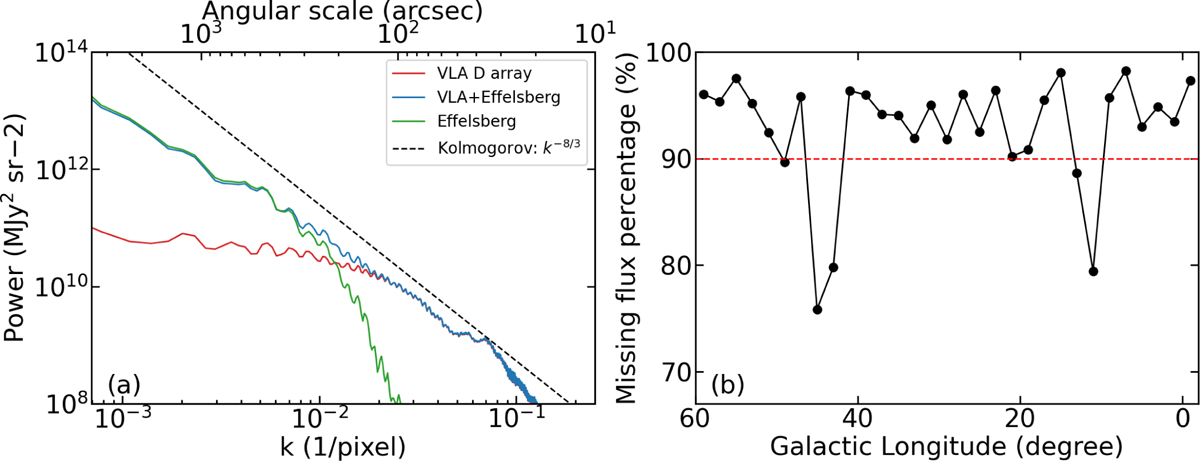
(a) Angular power spectra of the VLA-D array, Effelsberg-100 m, and VLA-Effelsberg combined images toward the representative region near the Galactic center (see Fig. 4). The 2D Kolmogorov-like spectrum is indicated by the dashed black line for comparison. (b) Percentage of missing flux of the VLA D-array data across the Galactic plane covered by the GLOSTAR survey. The horizontal dashed red line indicates a missing flux fraction of 10%.
Current usage metrics show cumulative count of Article Views (full-text article views including HTML views, PDF and ePub downloads, according to the available data) and Abstracts Views on Vision4Press platform.
Data correspond to usage on the plateform after 2015. The current usage metrics is available 48-96 hours after online publication and is updated daily on week days.
Initial download of the metrics may take a while.