Fig. A.4
Download original image
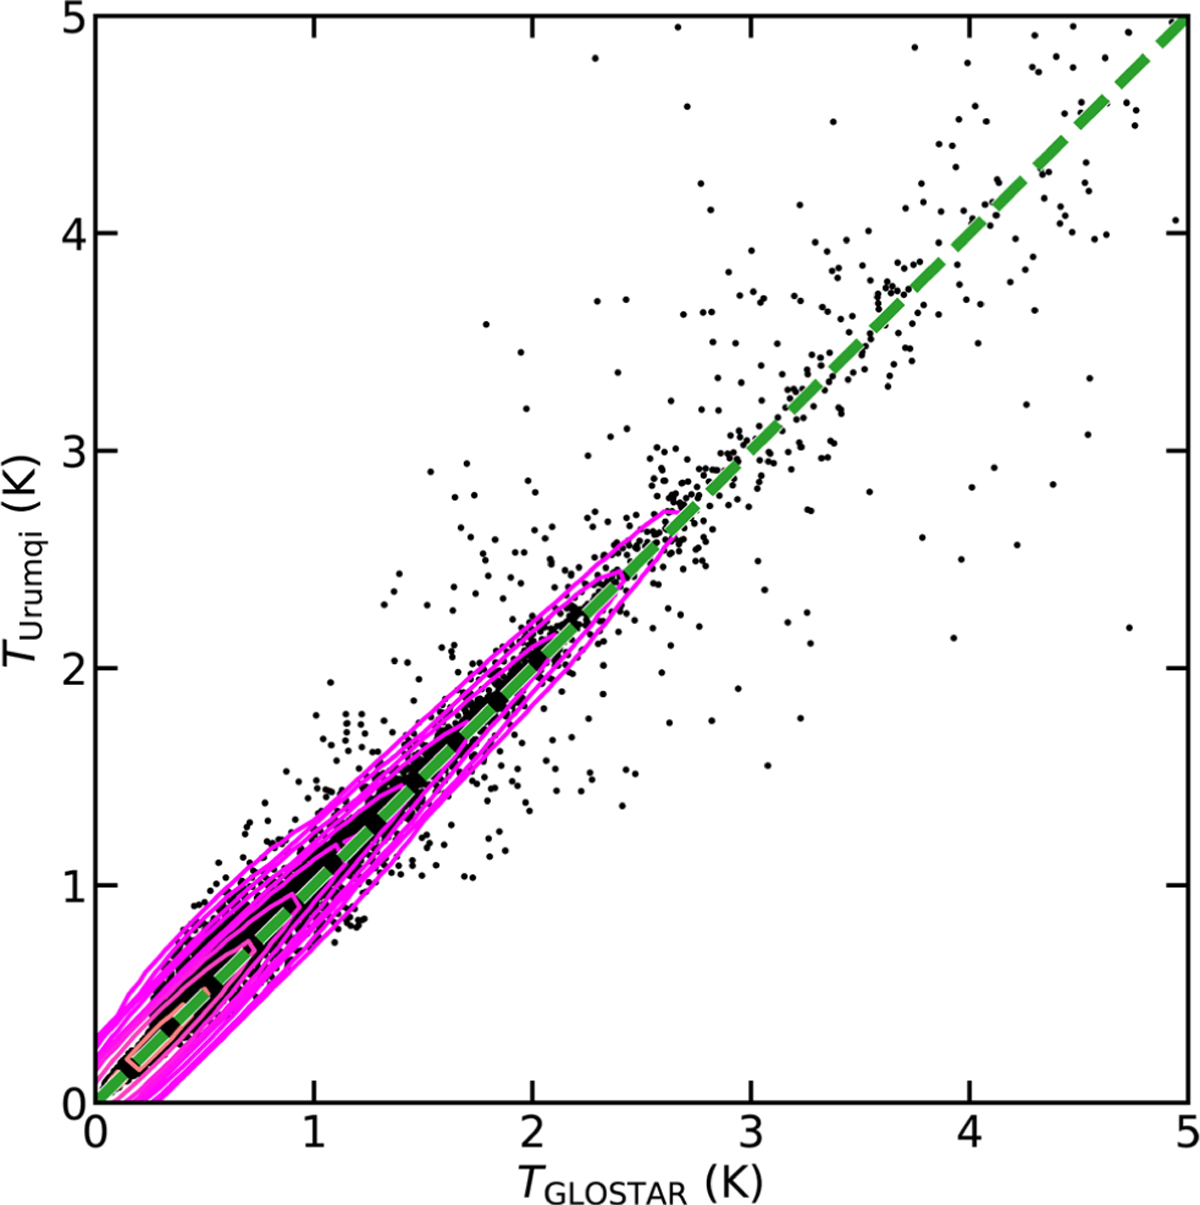
Comparison between the Urumqi 4.8 GHz survey and the Parkes 5 GHz survey. (a) Pixel-by-pixel comparison of the observed brightness temperatures of the two survey datasets within 10° < ℓ < 30°. The dashed red line indicates the equality between the two datasets. (b) Histogram of the brightness temperature differences between the two surveys. The vertical dashed line denotes the median value of 0.028 K. (c) Brightness temperature difference as a function of the Galactic latitude for ℓ = 11°65. The dashed red curve represents the polynomial fit to the observed distribution.
Current usage metrics show cumulative count of Article Views (full-text article views including HTML views, PDF and ePub downloads, according to the available data) and Abstracts Views on Vision4Press platform.
Data correspond to usage on the plateform after 2015. The current usage metrics is available 48-96 hours after online publication and is updated daily on week days.
Initial download of the metrics may take a while.