Fig. 1
Download original image
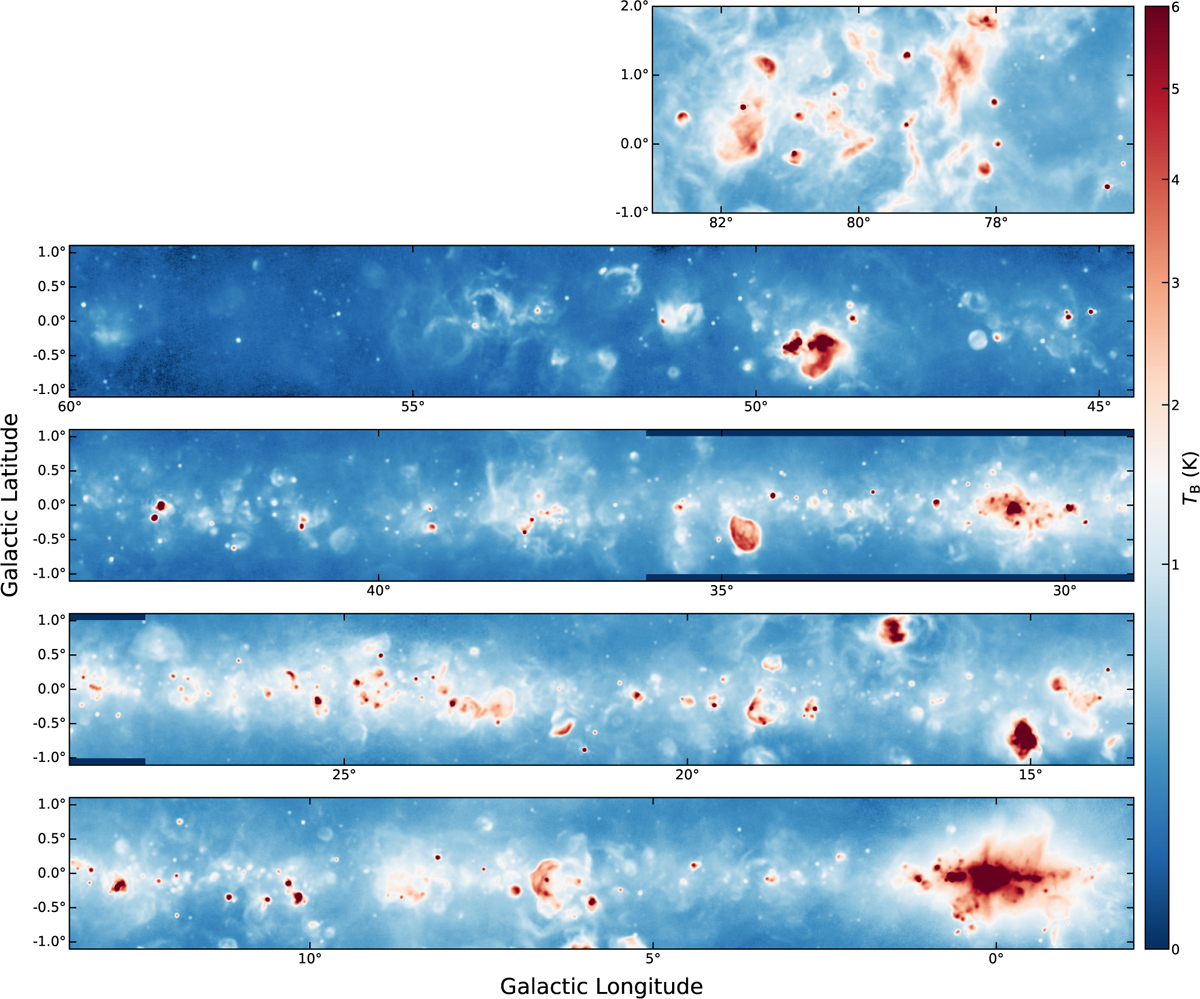
Effelsberg 4.89 GHz Stokes I continuum map of the entire GLOSTAR survey. Zoom-in plots of each fields are available via https://gongyan2444.github.io/glostar-snr-hii.html, where the green, gray, and red circles represent the known SNRs (Green 2025), SNR candidates (Anderson et al. 2017; Dokara et al. 2021; Anderson et al. 2025), and HII regions from the WISE catalog (Anderson et al. 2014), respectively.
Current usage metrics show cumulative count of Article Views (full-text article views including HTML views, PDF and ePub downloads, according to the available data) and Abstracts Views on Vision4Press platform.
Data correspond to usage on the plateform after 2015. The current usage metrics is available 48-96 hours after online publication and is updated daily on week days.
Initial download of the metrics may take a while.