Fig. 1.
Download original image
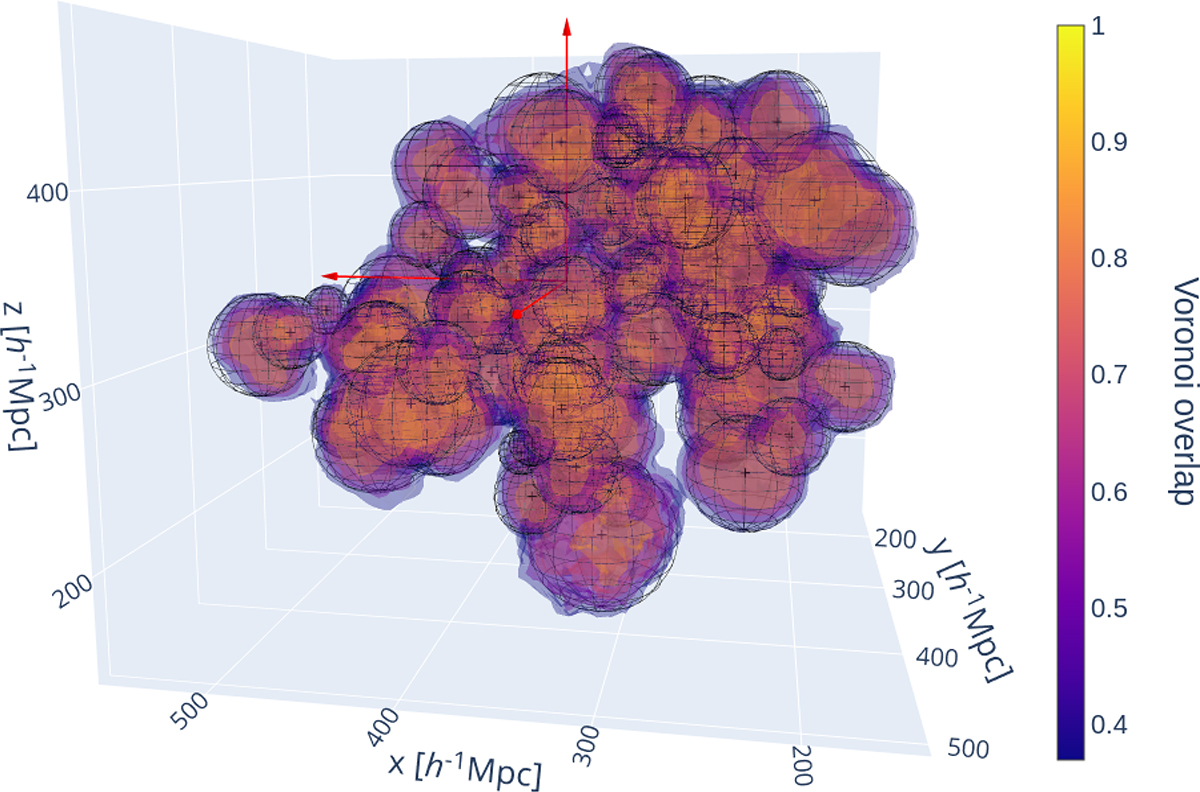
Visual representation of our catalog of 100 voids in the local neighborhood within a distance of ≈200h−1 Mpc. The color scale represents the Voronoi overlap rate, i.e., how often a point is contained in a void in different realizations. This quantity is loosely related to the density profile of voids, with high values representing the innermost underdense regions, while lower values are at the edges. The clouds are truncated at the value of 0.37 in order to preserve the statistical volume of all voids. Finally, the wire-frame spheres mark the effective volume of each void. The Cartesian axes are centered on the observer, the xy plane corresponds to the equatorial plane, and the ![]() axis points to the equatorial north pole. At very nearby distances, the method is able to reconstruct voids lying behind the Galactic plane, a region not observed in the survey. An interactive version of this plot can be found here: https://voids.cosmictwin.org
axis points to the equatorial north pole. At very nearby distances, the method is able to reconstruct voids lying behind the Galactic plane, a region not observed in the survey. An interactive version of this plot can be found here: https://voids.cosmictwin.org
Current usage metrics show cumulative count of Article Views (full-text article views including HTML views, PDF and ePub downloads, according to the available data) and Abstracts Views on Vision4Press platform.
Data correspond to usage on the plateform after 2015. The current usage metrics is available 48-96 hours after online publication and is updated daily on week days.
Initial download of the metrics may take a while.