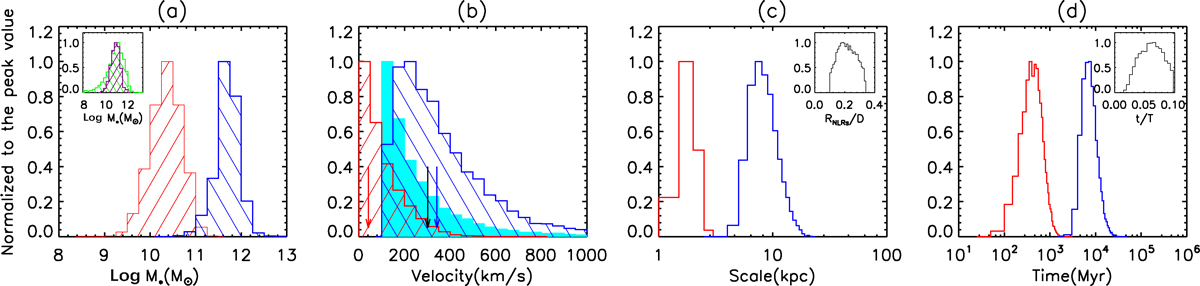
Fig. 2.
Download original image
Simulation results for the model adopting an elliptical orbit with an eccentricity of 0.2 and with galaxies initially at apocenter. Panel (a): Histograms filled in red and blue show the logarithmic total stellar mass distributions of the main and companion galaxies in the 10 000 satisfied simulations with DPNELs shifted in the same direction. Here, the top left inset displays the mass distributions for the galaxies in the collected main-sample (histogram in purple) and companion-sample (histogram in green). Panel (b): Histograms filled in red, blue, and cyan show the distributions of the smaller blueshifted velocity, larger blueshifted velocity, and velocity separation of DPNELs shifted in the same direction; the arrows in red, blue, and black mark the smaller blueshifted velocity, larger blueshifted velocity, and velocity separation of SDSS J001050.52−103246.6. Panel (c): Histograms in red and blue show the distributions of RNLRs and galaxy separation; the distribution of RNLRs/D is shown in the top right region. Panel (d): Histograms filled in red and blue show the distributions of the acceleration duration and orbital period; the distribution of the acceleration duration/orbital period (t/T) is shown in the top right region. All the histograms are normalized to the peak value.
Current usage metrics show cumulative count of Article Views (full-text article views including HTML views, PDF and ePub downloads, according to the available data) and Abstracts Views on Vision4Press platform.
Data correspond to usage on the plateform after 2015. The current usage metrics is available 48-96 hours after online publication and is updated daily on week days.
Initial download of the metrics may take a while.