Fig. 1.
Download original image
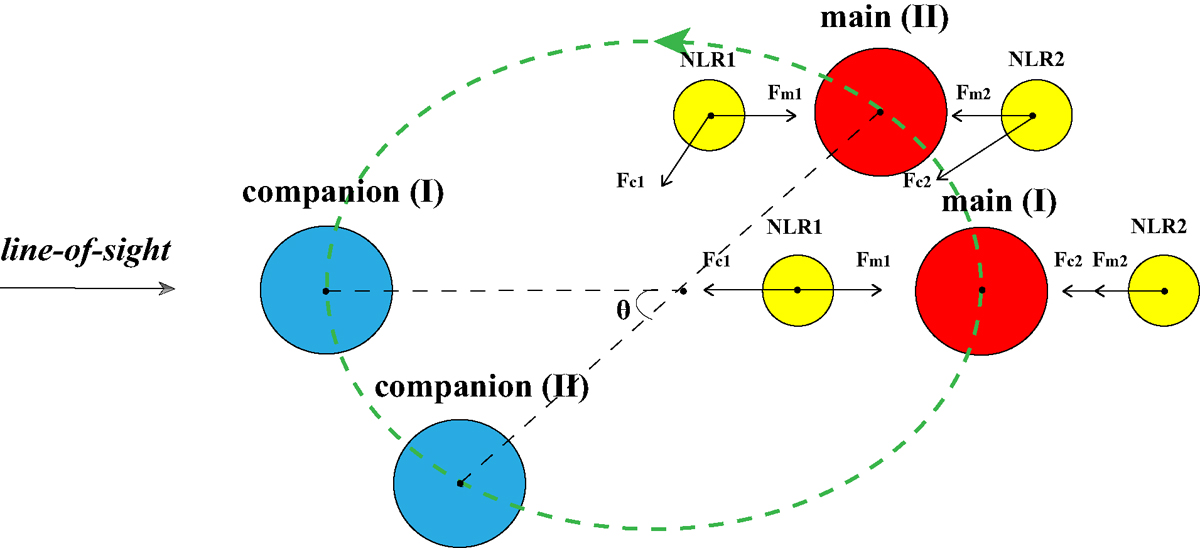
Diagram of the gravitational acceleration model with the two galaxies initially located at the apocenter of the elliptical orbit. The circles filled in red and blue represent the main and companion galaxies, respectively. The circles filled in yellow represent the NLRs of the main galaxy. The black arrows represent the gravitational force vectors. The green dashed line represents the clockwise elliptical orbit, with θ marking the rotation angle. System I indicates the initial positions of the galaxies in the simulation, aligned along LoS, while system II indicates their final positions. The arrow in the left region marks LoS.
Current usage metrics show cumulative count of Article Views (full-text article views including HTML views, PDF and ePub downloads, according to the available data) and Abstracts Views on Vision4Press platform.
Data correspond to usage on the plateform after 2015. The current usage metrics is available 48-96 hours after online publication and is updated daily on week days.
Initial download of the metrics may take a while.