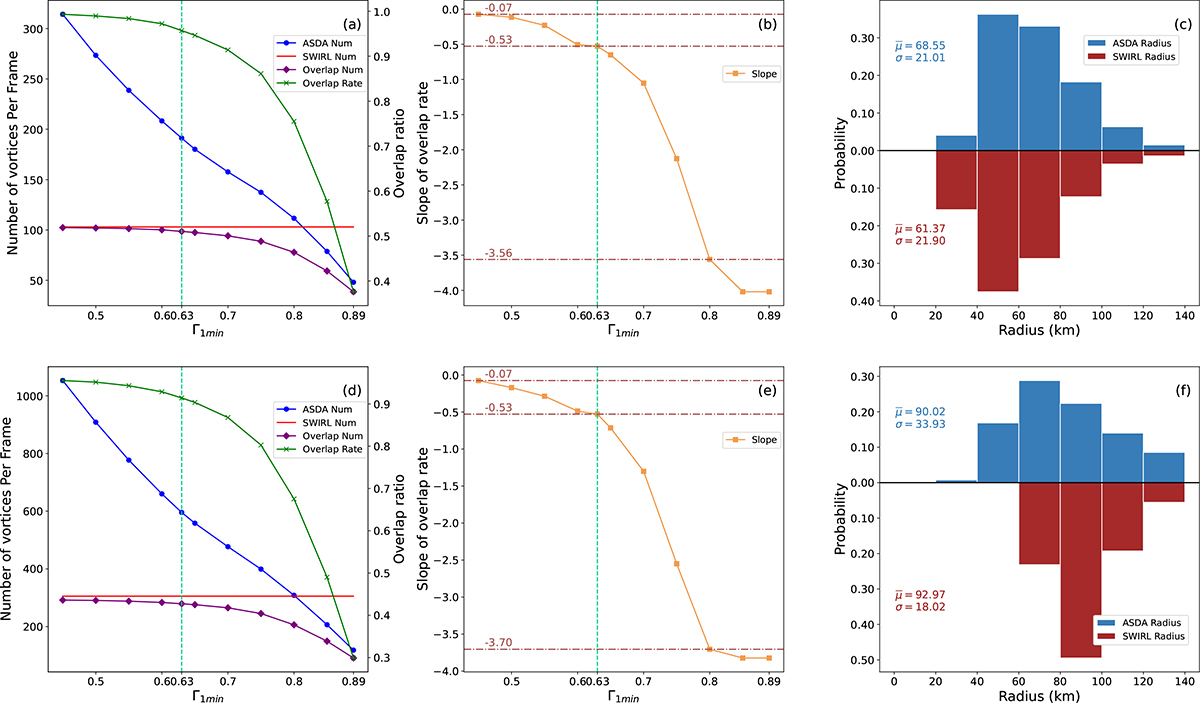
Fig. 5.
Download original image
Comparisons between the detection results obtained from the Optimized ASDA and SWIRL with numerical simulations. Panels (a), (b), and (c) show detection results from the photospheric simulation data. In panel (a), the blue curve and red horizontal line show the average numbers of vortices per frame detected by the Optimized ASDA and SWIRL, respectively. The purple curve shows the number of overlapping vortices detected by the Optimized ASDA and SWIRL, while the green curve indicates the corresponding overlapping rate. Panel (b) depicts the slope of each point of the green curve in panel (a). Panel (c) presents histograms of the radius distributions for overlapping vortices detected by the Optimized ASDA and SWIRL. Panels (d), (e), and (f) provide similar information for chromospheric simulation data.
Current usage metrics show cumulative count of Article Views (full-text article views including HTML views, PDF and ePub downloads, according to the available data) and Abstracts Views on Vision4Press platform.
Data correspond to usage on the plateform after 2015. The current usage metrics is available 48-96 hours after online publication and is updated daily on week days.
Initial download of the metrics may take a while.