Fig. 3.
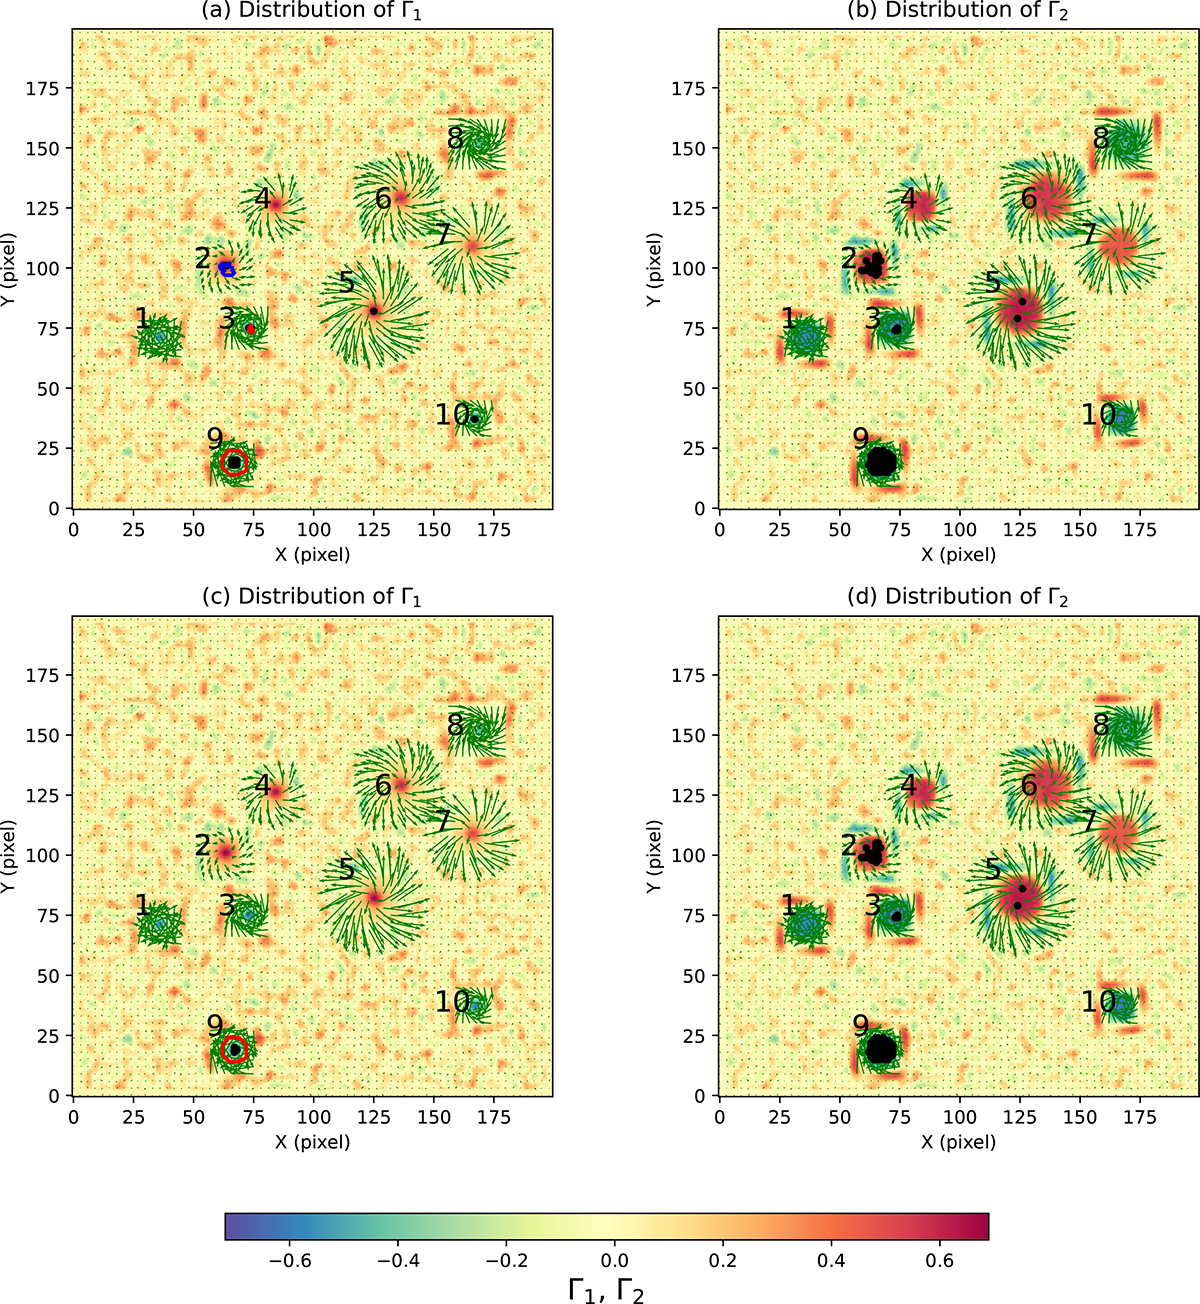
Download original image
Comparisons of detected results by ASDA under different criteria. Panels (a) and (b) show the distributions of Γ1 and Γ2 (backgrounds) in a 200 × 200 pixel2 region of SD2. Green arrows indicate the velocity field, and the numbers label the ten synthetic Lamb-Oseen vortices. Black dots in panel (a) mark points where |Γ1| ≥ 0.60, while black dots in panel (b) correspond to points where |Γ2| ≥ 2/π. Panels (c) and (d) are similar to (a) and (b), respectively, but the black dots show points where |Γ1| ≥ 0.65 and |Γ2| ≥ 2/π, respectively. Blue and red curves in these four panels represent the boundaries of vortices rotating counterclockwise and clockwise, respectively.
Current usage metrics show cumulative count of Article Views (full-text article views including HTML views, PDF and ePub downloads, according to the available data) and Abstracts Views on Vision4Press platform.
Data correspond to usage on the plateform after 2015. The current usage metrics is available 48-96 hours after online publication and is updated daily on week days.
Initial download of the metrics may take a while.