Fig. 2.
Download original image
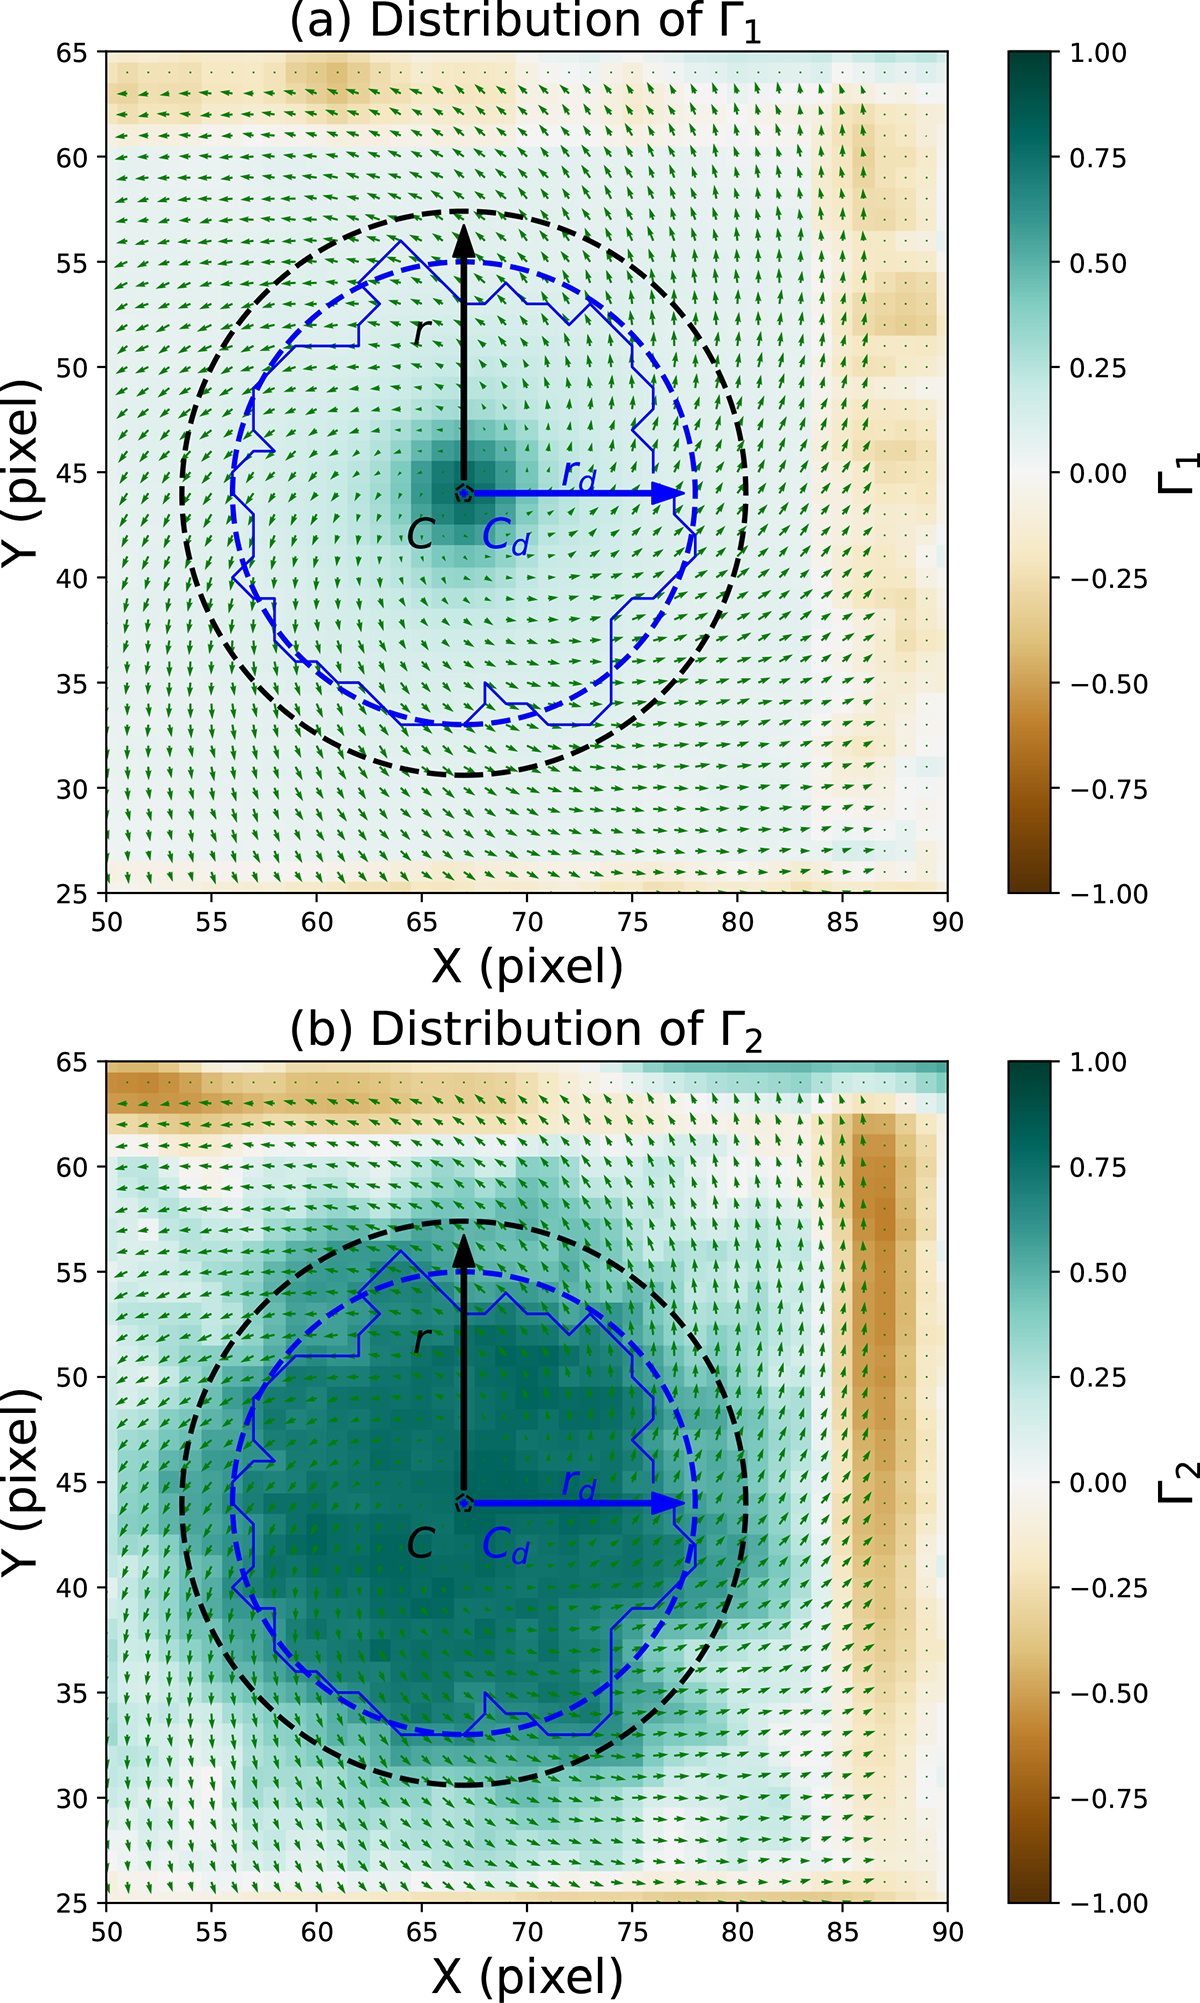
Example of a synthetic vortex and the corresponding detected vortex by ASDA. (a) Velocity field of the region (green arrows) and the synthetic vortex edge (black dashed circle) with center C (black text) and radius r (black arrow and text). The edge and center of the detected vortex are shown as blue solid curves and a blue point (Cd), respectively, with effective radius rd (blue text and arrow). The effective edge (blue dashed circle) is determined by the effective radius rd. The background shows the distribution of Γ1. (b) Same as panel (a) but with the background showing the distribution of Γ2.
Current usage metrics show cumulative count of Article Views (full-text article views including HTML views, PDF and ePub downloads, according to the available data) and Abstracts Views on Vision4Press platform.
Data correspond to usage on the plateform after 2015. The current usage metrics is available 48-96 hours after online publication and is updated daily on week days.
Initial download of the metrics may take a while.