Open Access
Fig. 6
Download original image
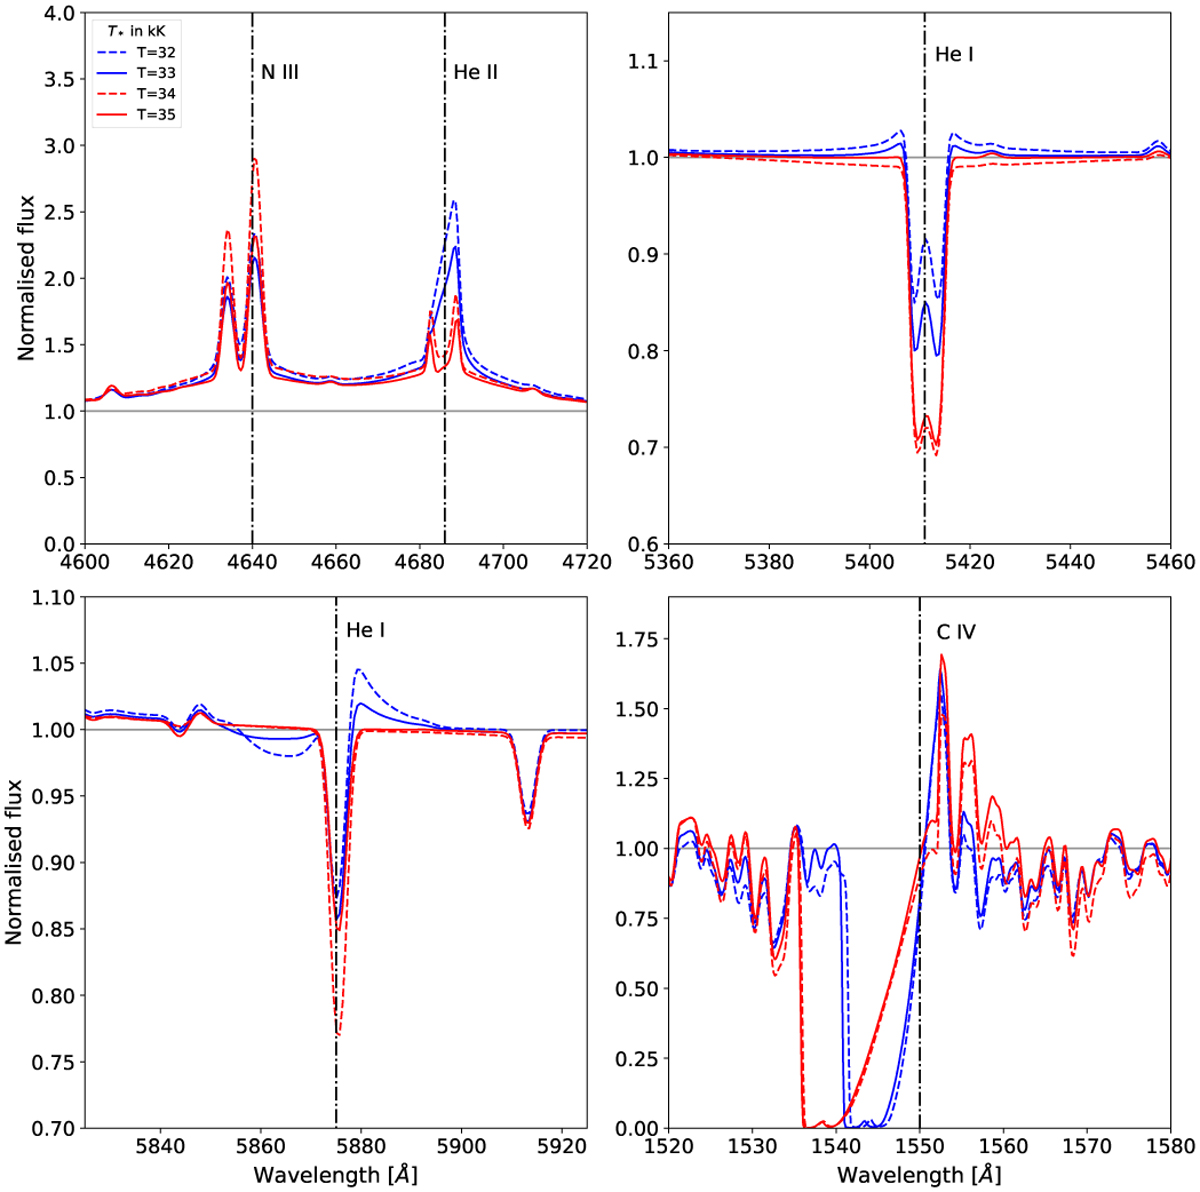
Similar to Fig. 3, but here for the Z = 0.6 Z⊙ sequence and with models over the sharp wind transition. An overview of the same models in the K band is shown in Fig. C.1.
Current usage metrics show cumulative count of Article Views (full-text article views including HTML views, PDF and ePub downloads, according to the available data) and Abstracts Views on Vision4Press platform.
Data correspond to usage on the plateform after 2015. The current usage metrics is available 48-96 hours after online publication and is updated daily on week days.
Initial download of the metrics may take a while.