Open Access
Fig. 5
Download original image
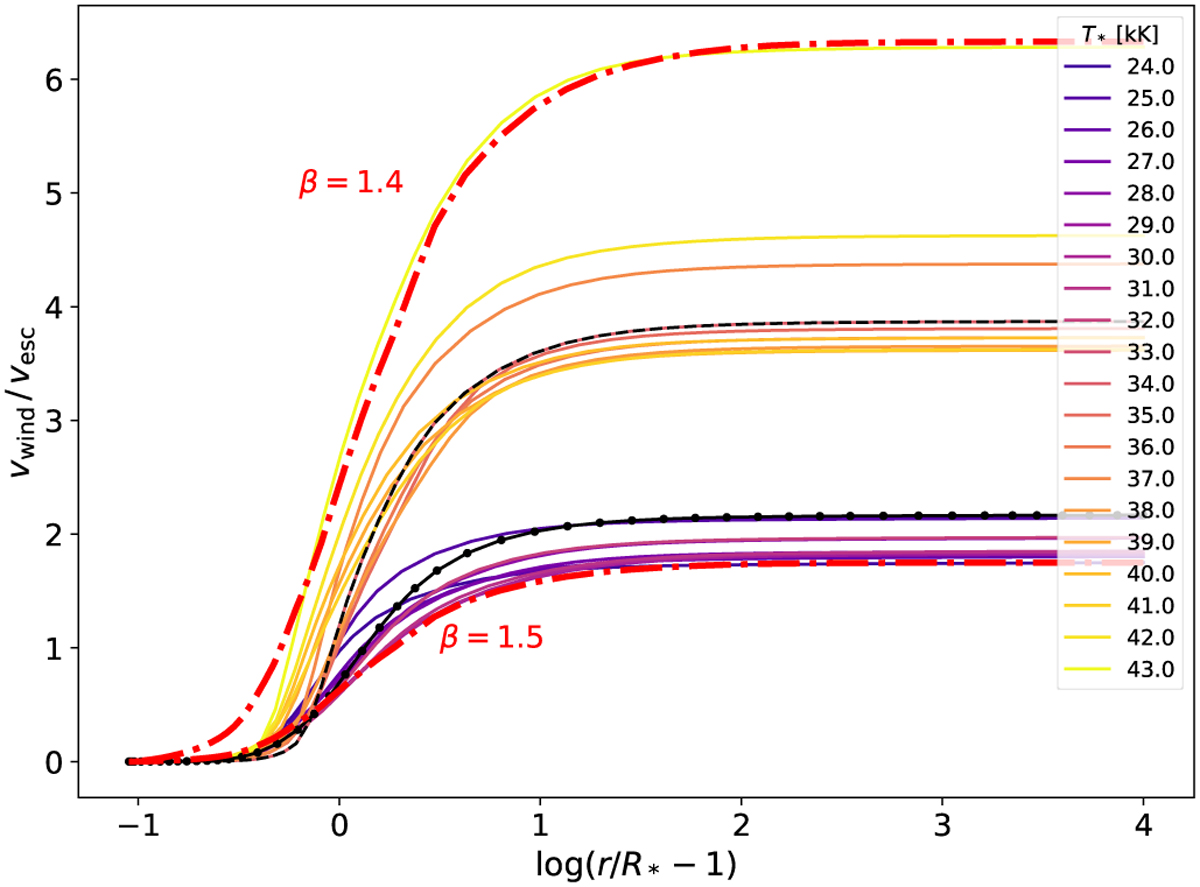
Velocity fields for the 0.6 Z⊙ temperature sequence. Similar to Fig. 2, the models adjacent to the sharp wind transition are shown. The dotted solid lines show the T* = 33 kK model, and dashed lines show the 34 kK model. Two β velocity laws are shown, with β such that they fit the coolest and hottest models closest.
Current usage metrics show cumulative count of Article Views (full-text article views including HTML views, PDF and ePub downloads, according to the available data) and Abstracts Views on Vision4Press platform.
Data correspond to usage on the plateform after 2015. The current usage metrics is available 48-96 hours after online publication and is updated daily on week days.
Initial download of the metrics may take a while.